Optimizing SQL In Memory Table Scan processing speed
How fast can you can actually read data from a table that is already loaded in memory?
People often assume that, once it’s in memory, it’s as fast as it can get and won’t get any faster ? But how fast is it really ?
Let’s find out!
The Math Method
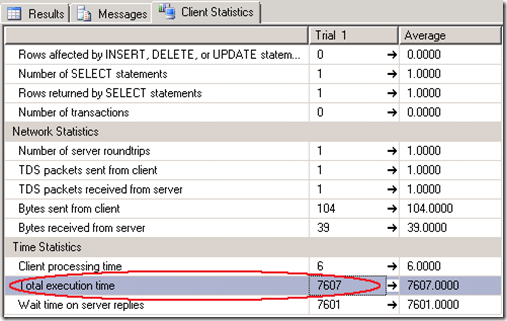
If the total table data size is known by looking at (sp_spaceused LINEITEM_SSD) and the total execution time we can find quickly by enabling the SSMS Client Statistics.
Then it’s just a matter of doing the math’s and divide 44491064 KB by 7607 milliseconds = 5848.7 Megabyte/sec to scan through a single table in memory.
Also the average rows read per second can be calculated by dividing 400 million rows by 7607 milliseconds = 52590 rows read/second.
Another option is to capture the stats with SQL Profiler and divide 5565037 Reads by 6601 milliseconds = 832.96 reads/sec * 8192 bytes == about 6.5 GB /sec .
These 2 examples already show an serious deviation in the average achieved throughput scanning the same data from memory.
So what other options do we have to determine the effective throughput figures , preferably realtime ?
Page lookups/sec
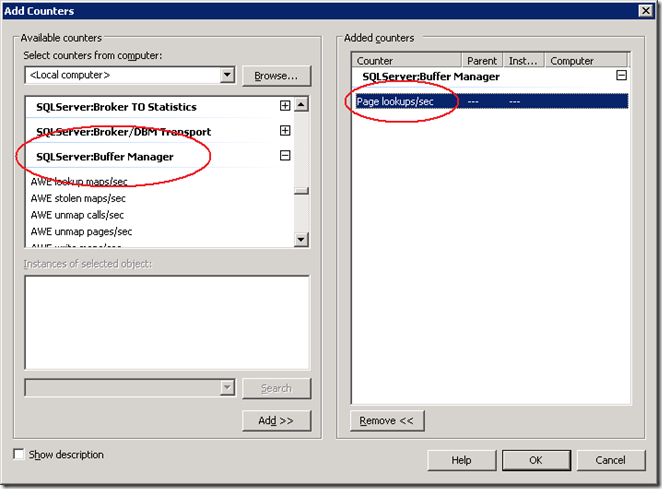
The best metric I typically use to check how fast you can scan data in the SQL Buffer Pool is to start the Windows Performance Monitor (Perfmon.exe)
and look at the “Page lookups/sec” counter which is listed under the SQL Server Buffer manager object:
It displays the “Number of requests to find a page in the buffer pool”, but I noticed that is also a representative counter to check how much data SQL is processing under the hood.
Each Page is 8 Kilobyte in size, so by multiplying the “page lookups/sec” number by 8192 you get an idea of how many bytes are touched each second.
Jeroen Kooiman a great programmer and colleague of mine wrote a nice graphical utility that allows me to show this type of derived values in real time.
Test 4a) Select COUNT (*) from LINEITEM_SSD
An easy way to force a full tablescan is to execute the command “Select COUNT (*) from <table>”.
When we execute this command on our LineItem test table of 43 GByte with 400 Million rows and read it from Solid State storage it takes 38 seconds.
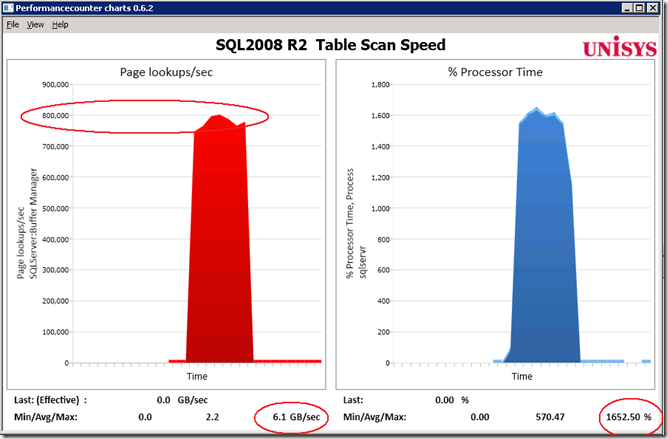
But once it is in memory, the Page lookup counter shows values between 770000 and 800000 page lookups/sec. It peaks at 6.1 GB/sec and SQLServer uses 1600% Processor time, or a total of 16 Cores while executing and the query completes in 7.7 seconds, almost 5 times faster then reading from Solid State.
So we can scan a regular table which is in memory with over 6 GB/sec. In my previous post on optimizing table scan speed I showed that partitioning a table brings a significant throughput gain and compressing the table even more. Let’s find out if partitioning and compressing the pages has impact on the average scan speed in memory too!
Test 4b) Select COUNT (*) from a Partitioned table
We run this test on a 96 core Unisys ES7000 system with 512 GB of RAM. Plenty of resources and memory bandwidth available.
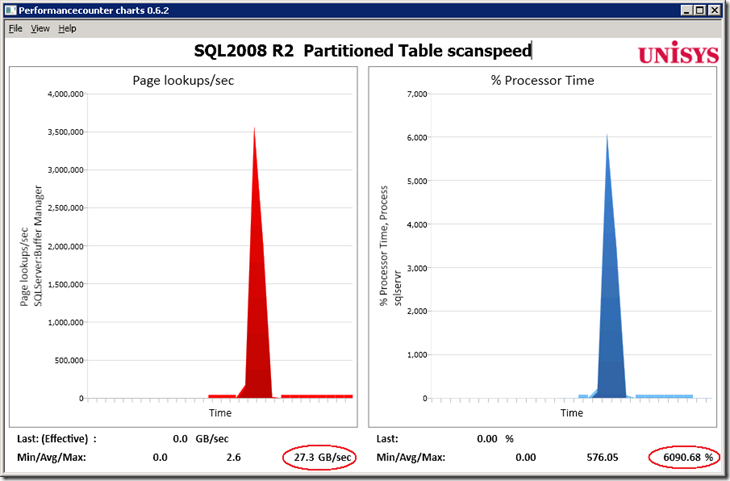
With the table partitioned in 96 Partitions, the tablescan speed increases with the SQL2008 R2 Nov. CTP to 27.3 GB/sec.
and also almost 61 cores are used. Scanning a partitioned table in memory is more than 4 times faster than an unpartitioned table and uses almost 4x more CPU resources.
SQLProfiler shows it takes only 2.2 seconds to read 400 million rows…
Test 4c) SELECT count (*) from LINEITEM_Hash96Key_SSD
option (MAXDOP 96)
During the previous test we where getting close to the default Maxdop of 64 cores;
and not yet utilizing all 96 cores. By specifying the query hint “option (MAXDOP 96) “ we can check if SQL will use more;
With the hint to use a maximum of 96 cores, the tablescan of 400 million rows / 46 GByte completes within 2 seconds !
Test 4d) Table scanning a Partioned and Compressed table that is stored as a Clustered Index
We ended the blog about tablescan optimization with the conclusion that a partitioned and compressed table provides the best throughput when reading from disk.
Will the this also be true for the data once it resides in memory ?
(Command to compress the pages: “ALTER TABLE [dbo].LINEITEM_hash96key_SSD_Compressed REBUILD WITH (DATA_COMPRESSION = PAGE “)
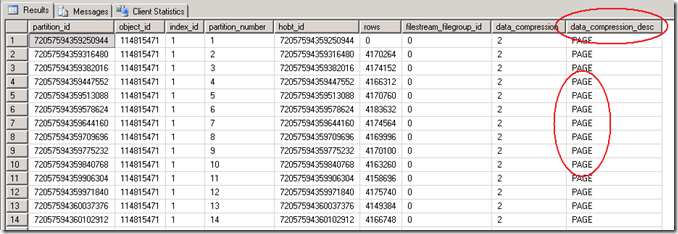
To determine the compression state of partitions in a partitioned table, query the the sys.partitions catalog view and check the data_compression column:
When we check the table with sp_spaceused LINEITEM_hash96key_SSD_Compressed
we see that the data size has been reduced significant because of the compression: from 44491064 KB it’s down to 19328312 KB, which is 56% less.
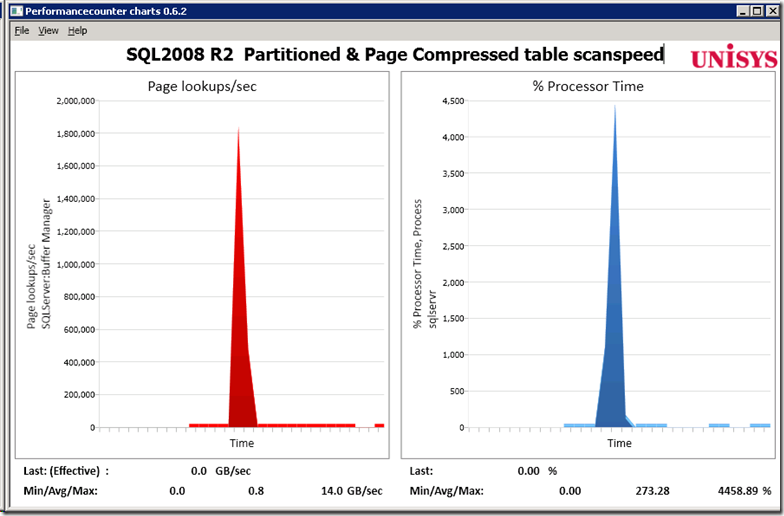
Executing the query SELECT count (*) from LINEITEM_Hash96Key_SSD_Compressed shows that the Page lookups/sec increases from 800K –
to over 1.8 million Page lookups/sec. The graph shows that the 400 million rows are scanned with 14 GB/sec, utilizing 44.5 Cores.
But what’s even more important, the query completes within only 1.3 or 1.4 seconds!
Wrap up
By looking at the Page Lookups/sec perfmon counter, you can get a pretty good picture of how much data SQL Server is processing.
The examples show that the overall memory scan speed increases significant (over 4 times) when you partition a table and the execution duration drops also significant.
By compressing the partitioned table , the tablescan is even faster by utilizing less CPU resources and Memory space and most important, the overall duration of scanning 400 Million rows which are stored in memory drops from 7.6 seconds to 1.4 seconds!







3 Responses Leave a comment
Hi Henk, Great to see that you’re blogging! You’ve always had fantastic information, so I’m very glad that you’re sharing it.
Have you considered syndicating your blog at SQLServerPedia or one of the other big sites?
Best regards,
-Kevin
Hi Kevin,
thanks; … I remember you signed me up also 5 years ago to present @ Pass Europe on SSIS ;-)
Hello:
Very nice & learning article, i appreciate your hard work. i want to know if there is any DMV which can give me same or similar info about SQL:Batch Completed from profiler.
Thanks
Jay