Co-author: Jeroen Kooiman (Unisys)
Most people prefer to handle BizTalk as a Black-box and don’t have a clue of what’s going on (or don’t want to ) inside the SQL databases. The overall performance of BizTalk very much depends on the performance of its databases, managed by SQL Server. As BizTalk operations are asynchronous processes by nature, SQL Server and the underlying infrastructure strongly determines the overall throughput of BizTalk. During BizTalk Quick scans & Performance optimization projects at customer production sites we noticed that there’s typically a lot of load thrown at SQL Server simply because full message body tracking (MBT) is enabled, storing lots of unnecessary debug & trace data that nobody ever will have a look at. Collecting MBT data in a production environment isn’t a recommended setting (except of course, if you are troubleshooting …). So in many cases a quick fix to reduce the overall BizTalk workload significant and to speed up the overall environment is to check if message body tracking is enabled and where possible, to turn it off.
We have seen BizTalk environments that came to a stall completely because of MBT and and also sites where 60% of all the SQL transactional load was caused by MBT.
How to check quickly if there’s unnecessary Message Body tracking activity in your environment
The MBT data is stored inside the dta_DebugTrace table of the BizTalk DTA database. With SSMS simply check during your coffee break if the size of this table is growing rapidly; (sp_spaceused “dta_DebugTrace”)
But some of the interfaces are maybe used only once a month, so we should look for a method that is more accurate.
Root cause analysis: which artifacts have tracking enabled?
There are two ways to check where tracking is enabled;
1) The hard way: you can go over each of the artifacts one by one and check manual if the “Track Message Bodies” options are enabled, but that’s a waste of your precious coffee break ;-)
2) The easy way: let a SQL query do the work for you! If you have many artifacts (hundred’s) to look after you might want to check them all periodically with a query, which we would also like to recommend to include as a formal sign-off item on your check list for new deployments.
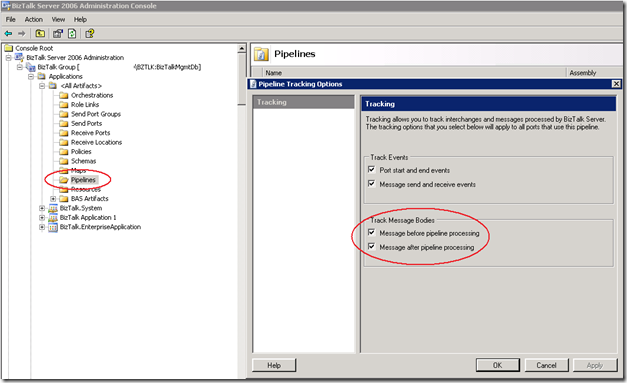
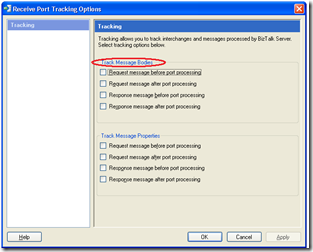
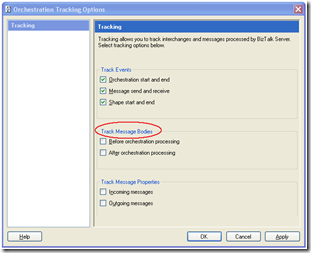
There are multiple locations in the BizTalk Server 2006 Administration Console (or through the HAT in BizTalk 2004 ) where Message body track can be enabled and disabled;
– On the Pipelines:
– On the Send/ Receive Ports and also the Orchestrations:
Execute the following query on the BizTalkMgmtDB to check which artifacts have tracking enabled:
bts_application.nvcName as ApplicationName,
'Pipeline Send' as [Artifact],
bts_pipeline.[name] as [Artifact Name],
bts_sendport.[nvcname] as [Artifact Owner Name],
bts_sendport_transport.nvcAddress as [Artifact Address],
StaticTrackingInfo.ismsgBodyTrackingEnabled as [TrackingBits]
from bts_pipeline
left outer join bts_sendport on bts_sendport.nSendPipelineID = bts_pipeline.[ID]
left outer join bts_sendport_transport on bts_sendport_transport.nSendPortID = bts_sendport.[nID]
left outer join adm_SendHandler on adm_SendHandler.[Id] = bts_sendport_transport.nSendHandlerId
left outer join adm_Adapter on adm_Adapter.[Id] = adm_SendHandler.AdapterId
left outer join bts_application on bts_sendport.nApplicationID = bts_application.nID
left outer join StaticTrackingInfo on StaticTrackingInfo.strServiceName = bts_pipeline.[name]
where StaticTrackingInfo.ismsgBodyTrackingEnabled is not null AND StaticTrackingInfo.ismsgBodyTrackingEnabled <> 0
union
select
bts_application.nvcName as ApplicationName,
'Pipeline Receive' as [Artifact],
bts_pipeline.[name] as [Artifact Name],
bts_receiveport.[nvcname] as [Artifact Owner Name],
adm_receivelocation.InboundTransportURL as [Artifact Address],
StaticTrackingInfo.ismsgBodyTrackingEnabled as [TrackingBits]
from bts_pipeline
left outer join adm_receiveLocation on adm_receiveLocation.ReceivePipelineID = bts_pipeline.[ID]
left outer join bts_receiveport on adm_receivelocation.receiveportid = bts_receiveport.nID
left outer join adm_Adapter on adm_Adapter.Id = adm_receivelocation.AdapterID
left outer join bts_application on bts_receiveport.nApplicationID = bts_application.nID
left outer join StaticTrackingInfo on StaticTrackingInfo.strServiceName = bts_pipeline.[name]
where StaticTrackingInfo.ismsgBodyTrackingEnabled is not null AND StaticTrackingInfo.ismsgBodyTrackingEnabled <> 0
union
select
bts_application.nvcName as ApplicationName,
'Orchestration' as [Artifact],
bts_orchestration.nvcName as [Artifact Name],
null as [Artifact Owner Name],
bts_orchestration.nvcFullName as [Artifact Address],
StaticTrackingInfo.ismsgBodyTrackingEnabled as [TrackingBits]
from bts_orchestration
left outer join bts_assembly on bts_assembly.nID = bts_orchestration.nAssemblyID
left outer join bts_application on bts_assembly.nApplicationID = bts_application.nID
left outer join StaticTrackingInfo on StaticTrackingInfo.strServiceName = bts_orchestration.nvcFullName
where StaticTrackingInfo.ismsgBodyTrackingEnabled is not null and StaticTrackingInfo.ismsgBodyTrackingEnabled <> 0
union
select
bts_application.nvcName as ApplicationName,
'Send Port' as [Artifact],
bts_sendport.[nvcname] as [Artifact Name],
null as [Artifact Owner Name],
bts_sendport_transport.nvcAddress as [Artifact Address],
nTracking as [TrackingBits]
from bts_sendport
left outer join bts_sendport_transport on bts_sendport_transport.nSendPortID = bts_sendport.[nID]
left outer join adm_SendHandler on adm_SendHandler.[Id] = bts_sendport_transport.nSendHandlerId
left outer join adm_Adapter on adm_Adapter.[Id] = adm_SendHandler.AdapterId
left outer join bts_application on bts_sendport.nApplicationID = bts_application.nID
where nTracking is not null AND nTracking <> 0
union
select
bts_application.nvcName as ApplicationName,
'Receive Port' as [Artifact],
bts_receiveport.[nvcname] as [Artifact Name],
null as [Artifact Owner Name],
adm_receiveLocation.InboundTransportURL as [Artifact Address],
nTracking as [TrackingBits]
from bts_receiveport
left outer join adm_receiveLocation on adm_receivelocation.receiveportid = bts_receiveport.nID
left outer join adm_Adapter on adm_Adapter.Id = adm_receivelocation.AdapterID
left outer join bts_application on bts_receiveport.nApplicationID = bts_application.nID
where nTracking is not null AND nTracking <> 0
order by 1, 2, 3
Sample query output
Background information
Message body tracking options for orchestrations and pipelines are stored in the BizTalkMgmtDb Database, to be more precise, in the ismsgBodyTrackingEnabled column of the StaticTrackingInfo table. The value of the integer column indicate which kinds of tracking are enabled. The first two bits of this number indicate whether tracking is enabled before (bit 0) or after (bit 1) processing.
Message body tracking for receive ports is stored in the bts_receiveport table:
Message body tracking for send ports is stored in the bts_sendport table:
Disabling MBT
Check with the owner of each of the artifacts which have MBT enabled if they enabled it on purpose because of some ongoing investigation in production (?)… or more likely, because they forgot to disable it ;-). You have to disable them manually through the BT Administrator Console or HAT (Note… do not modify this query to disable “things” for you; updating the BT SQL databases yourself may have serious impact on product support.) Also Purge the Tracking Database to remove unnecessary tracking data. (see: http://technet.microsoft.com/en-us/library/aa578470(BTS.20).aspx)
Wrap-up
Increase the IT-efficiency of your BizTalk environment(s) by checking the Message Body Tracking settings. The above query will provide you a list of all the artifacts that have tracking enabled for you quickly, before you even finished your first cup of coffee. Disabling unnecessary tracking will reduce the overall load on the BizTalk SQL Server tracking database, and therefore also reduces the network, disk and CPU load significantly.

