IT-Efficiency:Things to check during your coffee break

Many of the performance problems I have seen over the years where combinations of both hardware and software; some of them where very simple to detect and figure out and some have taken some time to resolve… There’s a very common one that you can detect easily during a coffee break , just by looking at the Windows Task Manager of the server that you are working on… Many of the server in your company are probably “out of the box” configurations which have never been thoroughly checked for both maximum disk and network throughput, or simply because of tight policies the network properties aren’t available to you. 


Use Task Manager to display the network throughput

The Windows Task Manager is general available to you and can be expanded quickly to display the effective real-time network throughput ; 

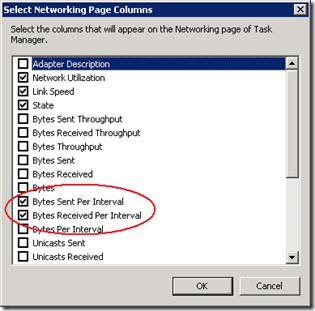
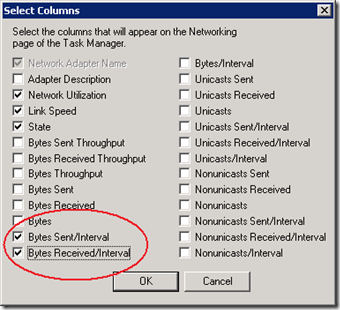
Open the Windows Task Manager, select the Networking tab, select View from the menu  and select both the columns, “Bytes Sent/Interval”  + “Bytes Received/Interval”

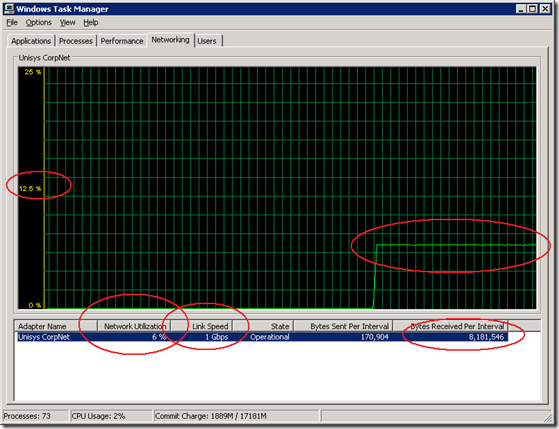
which by default are set to a 1 second refresh rate:

In Windows 2003 Taskmanager, Networking, select "View", "Select Columns" From Windows 2008R2  Taskmanager, Networking, select "View", "Select Columns"

So far probably nothing new under the sun… but here it comes; a 1Gbit network interface might show up as connected using a 1 Gbps Link Speed; in many cases (I’ve seen it at least a dozen times…) the effective throughput is way less because of either a network adapter is using a fallback rate , or it was negotiated by a switch as part of the “Auto Negotiate” handshaking, , or the network is patched into an old 100 Mbit switch, or simply because in the installation manual is stated that the link speed should be set to 100mbit Full Duplex…  

Coffee or Tea

With a fresh cup of coffee or tea  just have a look at the overall utilization and  throughput of the network. If the utilization is stuck around 12.5% you should now what time it is; you are looking at an network interface that is limited to effective 100Mbit/sec which has a max. throughput of 8 or 13 MByte/sec and this shows in Task Manager also as a Flatliner.

If you hear network folks talk about 1Gbit switch network utilization rates of max. 12.5% after they upgraded the backbone switches 6 months ago, it’s time to start smiling :-)

a network hardware limit; throughput shows a clear Flatliner 

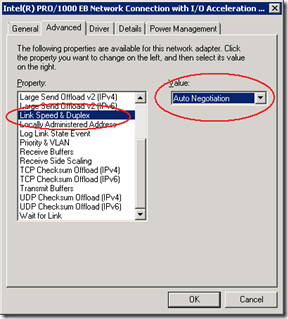
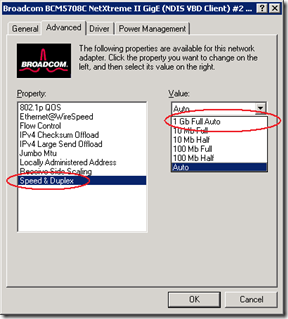
Some default Intel and Broadcom Network card settings will look similar to these:

Intel Network card Properties Broadcom Network Card properties 

How to test the throughput of a network interface quickly

To check the maximum throughput of a network interface yourself, a simple quick & dirty check is just copy some large files around,  a bit more work is using “scientific approach” and use a tool like NTttcp. (see also the network tuning tips from our ETL WR article: Initial Tuning of the Network Configuration with NTttcp  and http://www.microsoft.com/whdc/device/network/TCP_tool.mspx)

1) Map a network drive to the destination location based on TCP IP address (on the command line type NET USE * \\192.168.168.10\c$  as an example address)

2) Copy a large file (like a SQL Server installation file) from a couple of 100’s of Megabytes to the destination you just mapped;

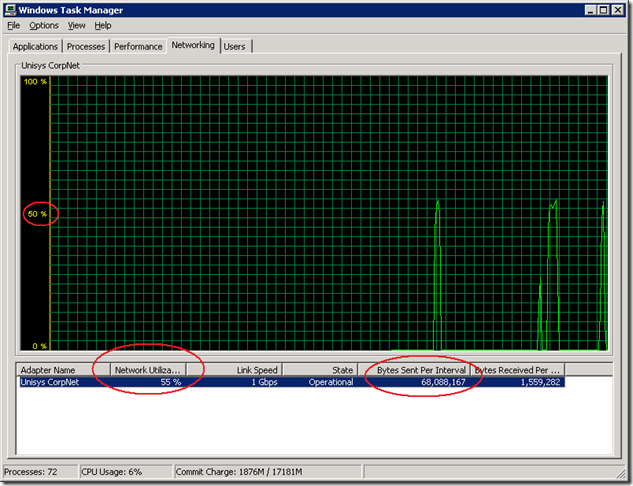
If you start a single file copy with the Windows Explorer,  you will see typically a throughput somewhere between 30-68 MByte/sec. As you can see, it’s much faster and not a clean steady flat throughput;

Single File copy operation on an 1Gbit link.

Jumbo frames

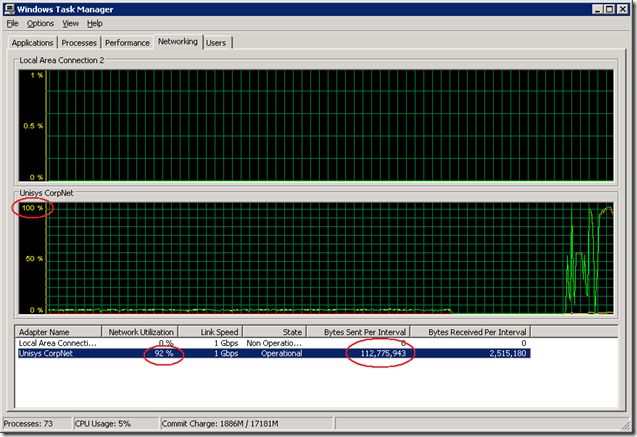
Check with you network folks if the network switches in your company support Jumbo frames;  if so it’s worth it to see if any recurring tasks like the overnight data loading can benefit from it; with support enabled for large Jumbo frames of 9000 , 9014 or even 16128 Bytes (versus the default , typically 1500 bytes for Ethernet), the throughput will go up to even over 100 MByte/sec per Gbit link!

Impression of Maximum 1Gbit NIC throughput


Wrap Up

Make it a habit to select the Bytes Sent + Received /Interval  in Task Manager and have a quick look at the throughput…  watch out for the 12.5% utilization and flat liners, indicating a bottleneck. If you run, for example SSIS data loading tasks from a different server than your database, you can get a significant higher throughput if you tune the network stack by either using Jumbo Frames.   If you speeded up one of your servers because of this tip, just leave a small comment ;-) !
Speeding up Reading from a SQL OLE DB or ADO.Net Data Source

With small datasets on a test system you will probably hardly notice the difference, but when you are building SSIS packages that need to process Gigabytes of data in a production environment on a day to day basis, the following Performance tip to optimize reading from the SQL data source is one to remember. 

1) Data Flow OLE DB Source creation

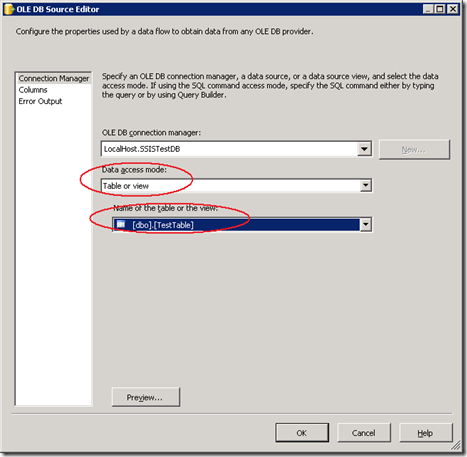
Very likely when you select your OLE DB (or ADO.Net) Source,  you pick the default data access mode “Table or view”  and the table with the data you need;

OLE DB Source Editor 

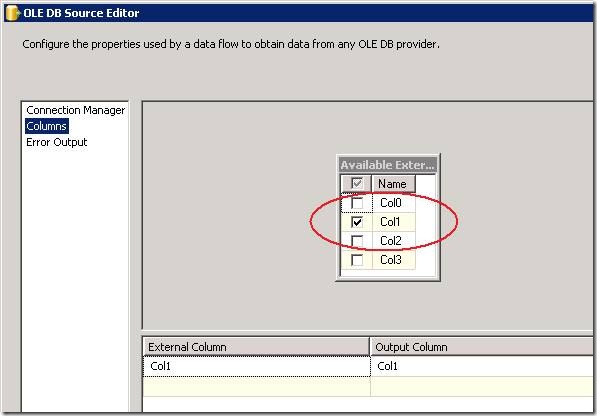
In our case,  it’s a TestTable which has 4 columns,   and lets deselect the columns we don’t need ;

 clip_image006

2) Measuring the throughput

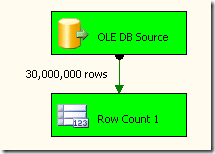
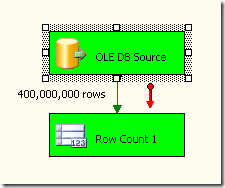
To check quickly the throughput of the Data Source  use the Row Count trick; count the rows and measure the elapsed time.

When we execute the package it takes 61.2 seconds to run the SSIS package, which is like 490 000 rows /sec.

Use the Row Count to  measure throughput

Surprisingly if you look at the SQL Profiler trace, you will notice that SQL Server executed from a  SSIS package a “Select * from [dbo].[TestTable] request which took 61.2 seconds !

This is strange; we just selected Column1 to execute the Rowcount on?  Or may be not…

Select * from Heaven

3) Be Selective

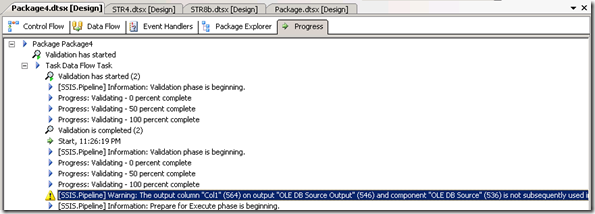
The default Table or View selection will always execute a “Select * from Heaven” and can become very costly if your database contains many columns (I will show you later the impact) but what’s important to realize is that the SSIS Progress tab will not warn you for this behavior… Typically if there are unused data columns or any room for improvement along the line you will see a warning in the Progress tab tune your package to avoid unnecessary data movement.

Pipeline warning

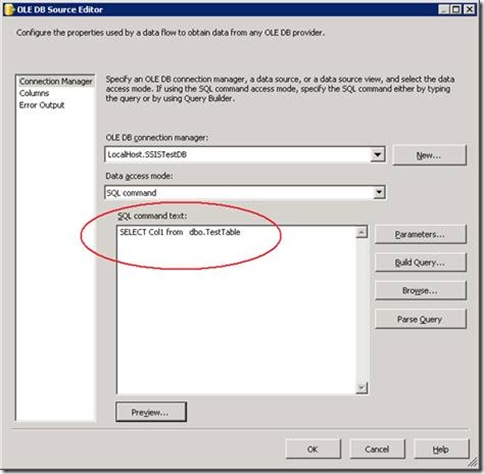
To increase the processing speed of you packages overcome the full table scans and transfer only the data that you really need. Be as selective as possible. In this case to retrieve just Col1:  Select a different Data Access mode, pick “SQL Command” (instead of “Table or view”)  and build a query SELECT Col1 from dbo.TestTable”. 

clip_image009 

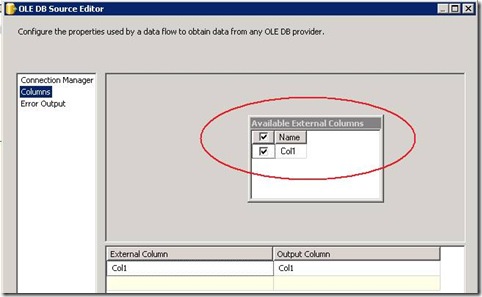
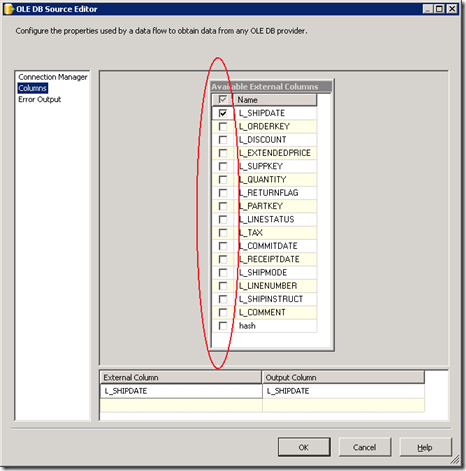
This query will only create 1 column as output which will show up in  the SSIS OLE DB Source Editor as a single available external  Column:

Only Columns needed available 

Result: with just column1  being retrieved,  it still takes 179148 reads, but only 26.9 seconds to get all the data transferred, instead of 61.2 seconds :

 Profiler trace of narrowed down column selection

Make it a habit to question yourselves where the untagged columns come from.

3a) Impact on Large Datasets

Just to show you the impact of what it take to scan a table with 400 million row , and 17 column wide data set..:

Howto create Bad Performance...

Duration: 29 minutes 55 seconds to scroll through all 400 Million columns:

image

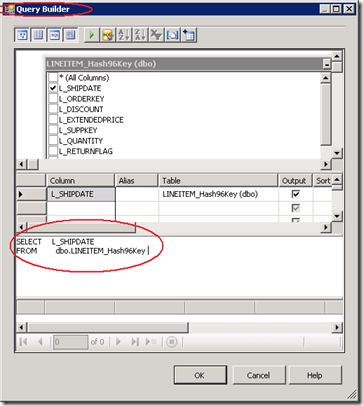
When you build a much more selective query by typing a statement or by using the Query Builder :

Retrieving the same L_Shipdates date takes only  6 minutes 17 seconds , which is  23 minutes and 38 seconds , or 79%… LESS Time!

SSIS Query Builder

Of course, by building you package using WHERE clauses and filter out the specific ranges you really need will make the optimization complete.


4) How to check existing SSIS Packages for the “Select * FROM heaven”

This an interesting question; at the moment I think the simplest way to get a hint where to start looking is to use a lightweight SQL Profiler trace that checks for:

1) SSIS Package executions + start date & time,
2) Table scans commands
3) The Row Count

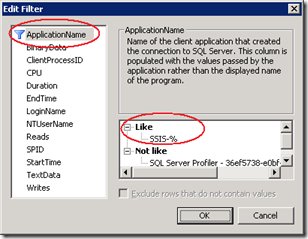
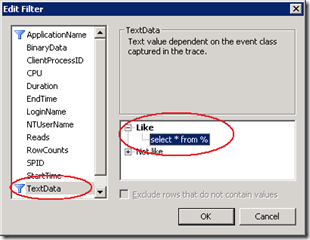
With SQL Profiler , the trace setup will look like this:  Apply 2 filters by clicking the “Column Filters” button:

– “ApplicationName” Like:  “SSIS-%”  and 
– “TextData” Like  “Select * from %”

Applying Profiler filter to capture tablescans TextData filter

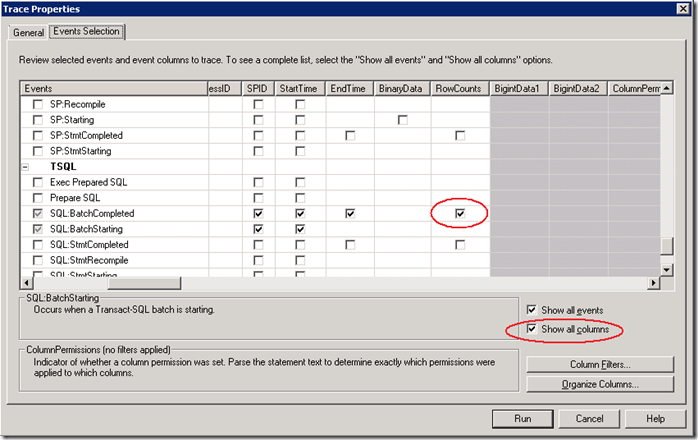
As third step, select the “Show all columns” option , look for the RowRounts column, and scroll in all the way down to the TSQL section to select SQL:BatchCompleted:

Select the RowCounts Column for SQL: BatchCompleted

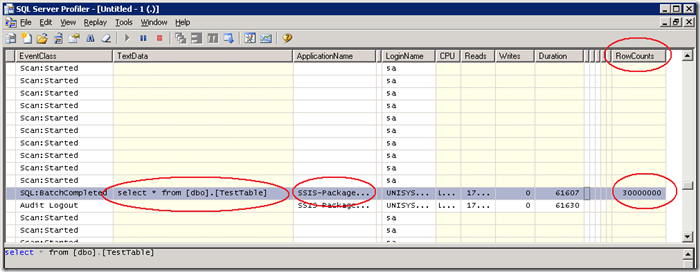
Result:

Result


5) Additional Reading

Luckily I found one location where this tip is written down also; Great SSIS book on page 414  of the book with lots of insights “Professional Microsoft SQL Server 2008 Integration Services, written by my friend Grant Dickinson and other great guys like Brian Knight, Erik Veerman, Douglas Hinson, Darren Herbold.   


Wrap up

With the walkthrough example above I showed you the impact on the overall performance when using the default SSIS “Table or view’ data source selection on small and large data set, and also the effect on the overall runtime of your SSIS packages. Check your most demanding (or long running) packages on their selectivity and narrow down the number of columns you are requesting from the database where possible. Move only the data around that you really need!