Maximizing SQL Server 2008 R2 Table scan speed from DSI Solid State Storage

Scenario:

Imagine you have a single table with 400 Million rows and 46 GByte in size that you want to read as fast as possible. How can you check if you run @ top speed?

This blog post is all about squeezing the maximum out of both SQL Server and the available hardware and showing you how to measure the achieved throughput and durations the way I do.  in the previous post I showed what throughput figures are possible with the SQLIO utility, now it’s time to see if we can get the same throughput with SQL Server 2008 R2 !


Test 3a) Table scan speed from a single table stored in a single database file

image

Step 1 is to test with an ‘out of the box’ configuration and see that reading a table with 400 million rows / 46 GByte of size with LineItem data takes 31.2 seconds.

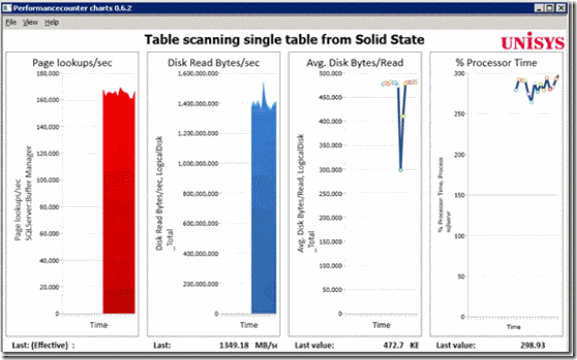
The Windows Performance monitor Logical Disk counter “Disk Read Bytes/sec” shows an average of  around 1400 MB/sec reading from the DSI 3500 Solid State box:

 clip_image002

The SQL Profiler  shows that approx. 5.5 million logical (8KB) reads are needed to retrieve the 46 GByte of data.

clip_image004


What are we waiting for?

The top 2 from the Waitstats dmv (select * from sys.dm_os_wait_stats)   shows 80.1% of the time SQL was waiting, is spend by LATCH_EX and 9.3% by PAGEIOLATCH_SH: 

clip_image006

To read a page from disk and put this into cache, the worker thread will take out a EX (Exclusive) latch on the BUF associated with the page. 
(See also this CSS post for more information: http://blogs.msdn.com/psssql/archive/2009/07/08/q-a-on-latches-in-the-sql-server-engine.aspx)

Or looking into the exclusive LATCH_EX  wait type as described in BOL:  a LATCH_EX  occurs when waiting for a EX (exclusive) latch.

This does not include buffer latches or transaction mark latches.  A breakdown of LATCH_* waits is available in sys.dm_os_latch_stats. 

Following the books and drilling down into the latch waits with the sys.dm_os_latch_stats dmv shows the following:

clip_image008

On the "ACCESS_METHODS_DATASET_PARENT”  latch wait type isn’t much information available, but think of this as a memory semaphore that is used to distribute the pages scanned from disk to the operators downstream in the query plan, synchronizing child dataset access to the parent dataset during parallel operations.

From several experiments I have noticed that this type of  latch wait time doesn’t expose a direct relation to the overall duration of the query execution while table scanning a single table , so lets call it SQL internal housekeeping.

The PAGEIOLATCH_SH wait event occurs when a task is waiting for a latch for a buffer that is in an I/O request. When a page is not in the buffer cache, SQL Server has to first allocate a buffer page, and then puts a exclusive PageIOLatch_ex latch on the buffer while the page is transferred from disk to cache.

Meanwhile, SQL Server puts a PageIOLatch_sh request on the buffer on behalf of the user. After the write to cache finishes, the PageIOLatch_ex latch is released. This allows the user to read the buffer page after which the PageIOLatch_sh is released. The 12.1% contribution of the Buffer Latches  as primary wait reason makes more sense.

Since we know from the SQLIO tests that we use only half the available throughput bandwidth an easy option to get more I/O requests being serviced  is to add  more database files and more LUN’s to distribute the IO load. 


Test 3b)  Adding a second LUN and database file

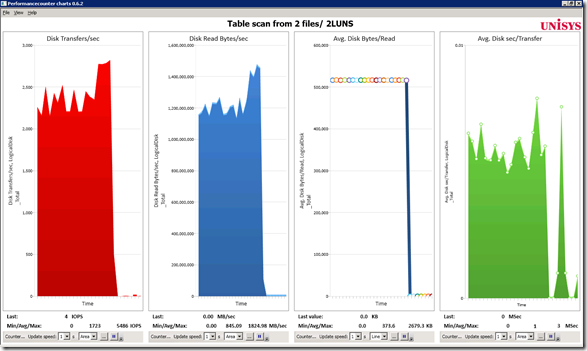
Surprisingly with the table striped over 2 database files and 2 LUNS in the same filegroup , in my tests it takes longer to read the same 400 Million rows; on average 36.9  seconds instead of  31 seconds. That’s strange… as shown with the SQLIO tests (and also by common sense) you would expect that adding a second LUN  and more files would speed up data retrieval.  … interesting.  The graph below the average throughput (Disk Read Bytes/sec) slightly dropped to about an average of 1300 MB/sec and the disk transfer timings are average 1 millisecond. 

image

image 


Test 3c) Table scan speed from a partitoned table with 96 partitions/24 database files and 24 FileGroups

What else can we do to speed up table scanning ? About a year ago while Thomas Kejser (from he SQLCAT team http://sqlcat.com/ ) and I where preparing a presentation for the PASS European Conference 2009 conference (btw please checkout the new 2010 conference website @ http://www.sqlpass.org/summit/eu2010/ ) when we came up with the following trick to speed up the tablescanning significantly :  partition the table and apply a special hashing algorithm to equally distribute the data across the partitions.

This will enable multi threading data retrieval from multiple partitions.


Steps to take:

1)  Optimal number of partitions should be equal to the number of available cores (96)

2) Create multiple Filegroups to hold the partitions (24)
3) Partition the tables into #cores partitions 

4) Use the CREATE PARTITION FUNCTION command

image 

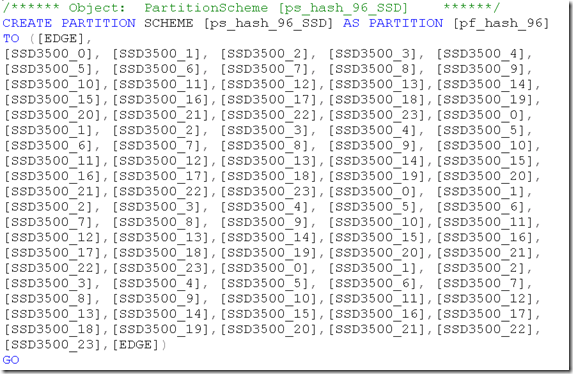
5) Use the CREATE PARTITION SCHEME command  and bind the partition function to Filegroups

image 

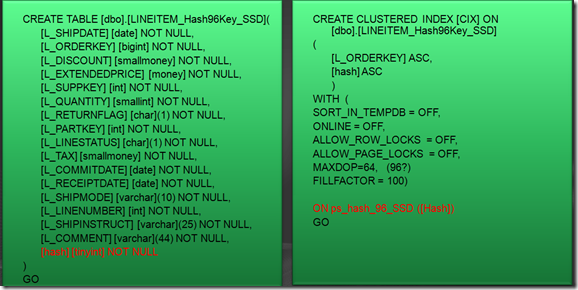
6) Add a hash column to the table (tinyint, just one byte per row)
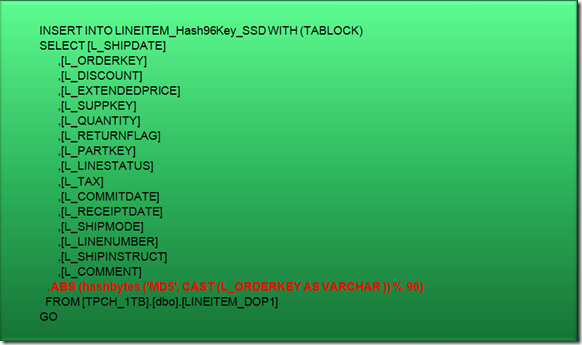
7) Calculate a good hash distribution , for example, use hashbytes with a modulo function
8) Build a clustered index on the table, on the partition scheme

image

9) Insert data  with some magic hashing algorithm key:

image


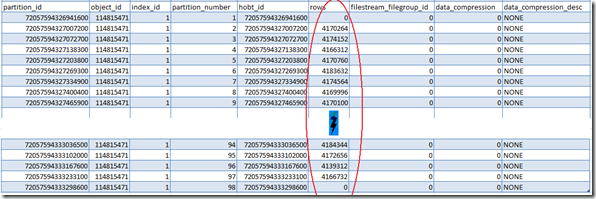
10)  Check if all partitions are about equally filled: 

Run the  Select * from sys.partitions where  object_name(object_id)=’LINEITEM_HASH96key_SSD’

and check out the amount of rows per partition:

image


11) Rerun the command :  SELECT count (*) from LINEITEM_Hash96Key_SSD

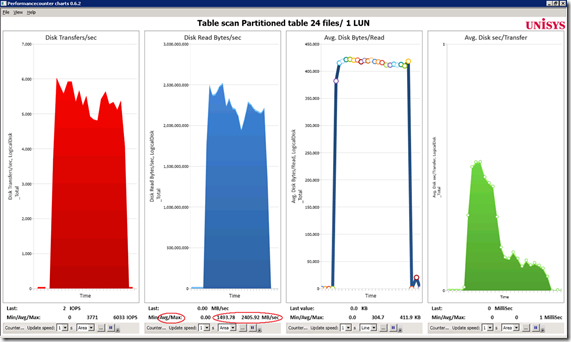
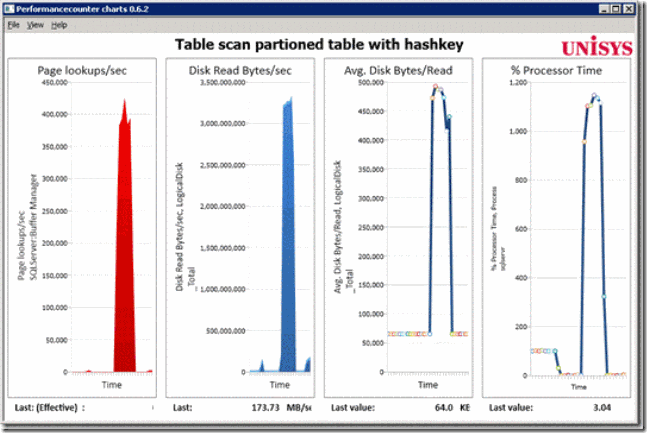
Result of table partitioning on overall throughput and duration is shown below: it takes only 19.88 seconds  instead of 31.2 seconds,

so 11.3 seconds or 36% faster.  That’s an interesting gain!

image

image

Waitstats

the no. 1 waittype , with 78% , is time spend by waiting for PageIOLatch_SH,  with an average of 180 Millsec per event, means a  disk bottleneck; 

We are maxing out on our single LUN.

image

Latchwaits

image


Test 3d)  Table scanning from a partitoned table with 96 partitions, 24 db files, 24 FileGroups and PAGE Compression


A last tip: enabling Page compression on the table will also speed up  scanning: 

command:  ALTER TABLE [dbo].LINEITEM_hash96key_SSD REBUILD WITH  (DATA_COMPRESSION = PAGE )


Result:  we can now scan 400 million rows / 46 GByte of data in only  6.2  seconds..   or in only 20% of the time.

clip_image010

 image

Wait_types

image

Latches:

image 

Additional information

World’s Fastest Flash-Based SSD:  The DSI 3500 Solid State:  http://www.dynamicsolutions.com/main-menu/dsi3500 

Unisys whitepaper: Microsoft SQL Server 2008 Data and Backup Compression:   http://www9.unisys.com/eprise/main/admin/corporate/doc/41371394.pdf 

Wrap up

The examples above show that SQL table scan operations can be optimized greatly; partitioning a table or applying some sort of compression  makes a significant difference in overall scan speed.
DSI 3500 / (RAMSAN-500) Solid State Storage to the test

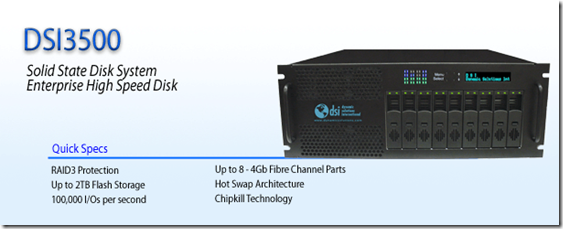
Flash storage was one of several products Gartner listed as among "the most important technologies in your data center future." So … time to publish about a great device we have in the performance Center, for our customers to test their high-end solutions on; a 1 Terabyte DSI3500 with the full 8x 4Gbit fibers hooked up an 96 core ES7000 Enterprise Server with 512G RAM and 16 Dual port Emulex LPe12002-M8 and LPE 11002-M4 HBA’s, Windows 2008R2 Datacenter and SQL 2008 R2 (November CTP). Let’s put it to the test and see why!

image

image

On the DSI website (http://www.dynamicsolutions.com/sites/default/files/DSI3500.pdf) is stated:
“ the DSI3500 blends two different solid state technologies, RAM and Flash, to create the industry’s first Cached Flash system. A loaded system consists of 2TB of usable RAID protected Flash capacity and up to 64 GB of DDR RAM cache. The DSI3500 takes advantage of this large DDR RAM cache to isolate the Flash memory from frequently written data and to allow for massive parallelization of accesses to the back end Flash. By using a large DDR RAM cache, sophisticated controller, and a large number of Flash chips, the DSI3500 is able to leverage the read performance, density, and sequential write performance of Flash. The unique advantage of the DSI3500 is its tight integration of high capacity Flash storage and the large high-speed DDR RAM cache. The 16-64 GB RAM cache provides a sustained dataflow (2-GB/sec) between Flash storage and the SAN Enterprise Servers. Its 2-8 Fibre Channel ports provide true access to exceptional bandwidth and IOPS capability.”

So …let’s see it we can squeeze 100K IOPS and 2 GByte/sec out of it … ;-)


Installation and configuration

Installation is a straight forward process, below the steps to configure the Windows MPIO, the DSI to expose some LUNS and a Windows mointpoint.

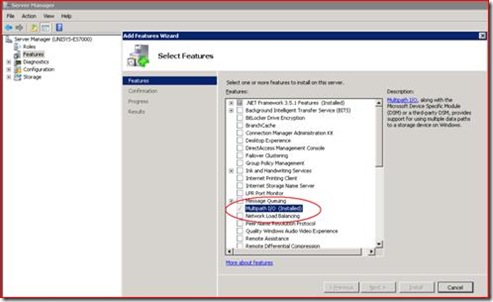
1) Plug in a fiber, network cable and 2 power cords into the DSI and aclip_image006ctivate the Windows Multipath I/O (MPIO) feature:


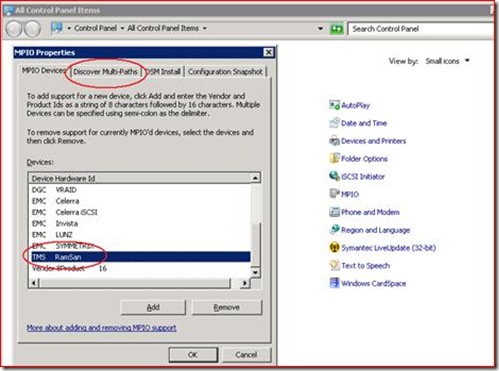
2) In the Windows Control Panel, Select the MPIO icon, the tab “Discover Multi-Paths” and select TMS RamSan, Press “Add button” and after a reboot It will show up in the MPIO device list:

clip_image008

3) Hook up all 8 fiber cables.

4) Configure the DSI:

– Use either a DHCP address or assign one manually through the front panel menu and start a web browser to the address;

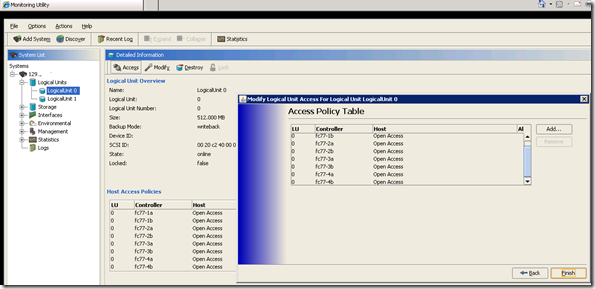
Configure 1 or more LUNs, I configured 2 LUNs of both 512000 MB  and set the access policy to have “Open Access” on all 8 fiber controller paths.

With 8 shared fiber paths to the LUNs this will allow maximum throughput.

image

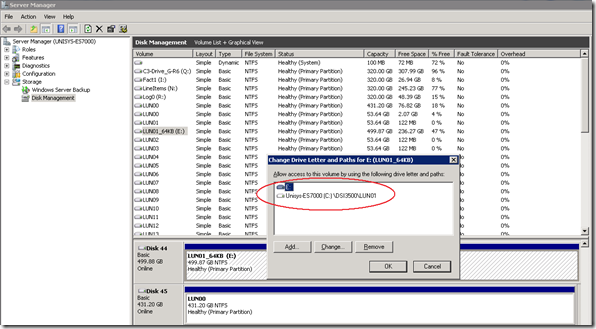
5) Create a Windows Mount point to each of the LUNS and format the LUN with 64 KB NTFS format . And that’s it!

image

Within 30 minutes the whole installation is complete and ready to go.

Test 1a): Testing the Maximum throughput with SQLIO for 256 KB Random Reads on a 10 GByte file.

a great and simple utility to check out the IO metrics of a storage subsystem is the SQLIO utility.  Typically  there are 2 things to check first:

the maximum number of IO’s that can be processed (small 8 KB IOs)  and the maximum throughput (MBytes/sec with larger 256 KB or more blocks).

By default SQLIO will allocate only a small file of 256 MB to test with, which results typically in all cache hits without touching the disks or SAN backend  so

we will specify to test with a larger  10 GByte file.

(SQLIO is downloadable here: http://www.microsoft.com/downloads/details.aspx?familyid=9a8b005b-84e4-4f24-8d65-cb53442d9e19&displaylang=en)

Command: sqlio -kR -s180 -frandom -o8 -b256 -LS -Fparam-READ-DSI3500-1file_1lun.txt
Content of parameter file:
c:\DSI3500\LUN00\testfile.dat 1 0x0 10000

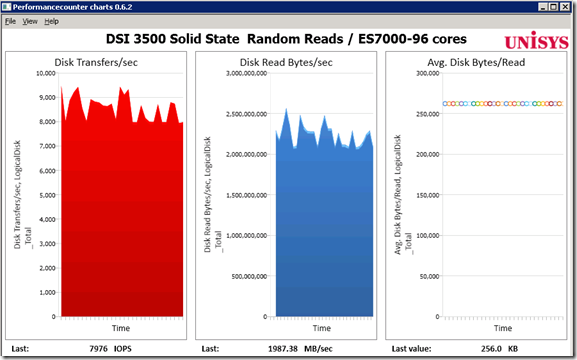
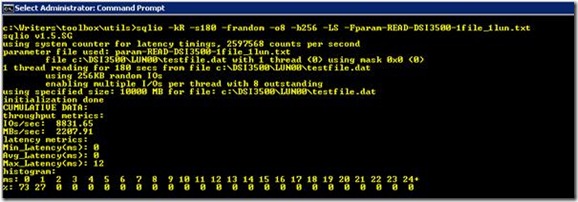
Result: Random 256 KB reads from a single 10 GB file: 2207.01 MB/sec! and an average latency of “zero” milliseconds as reported by sqlio : 72% of the IOs completed in 0 msec and 27% of the IOs completed in 1 msec.

image

clip_image016

So with just one file and 1 thread reading we are already reading more data than what is specified by DSI (2GB/sec) .

This throughput is already amazing,  but by doing some quick math’s : if we have a total of 8 fiber paths, with a theoretical maximum of 8x 4Gbit/sec, which is close to 3200 MB/sec!

The most obvious reasons to get the random read throughput up is to add more threads to read from the same file or specify more files to read from in parallel.

SQLIO supports both tests by making some changes to the parameter file:

Test 1b): Testing the Maximum throughput with SQLIO for 256 KB Random Reads on a 10 GByte file with 2 threads.

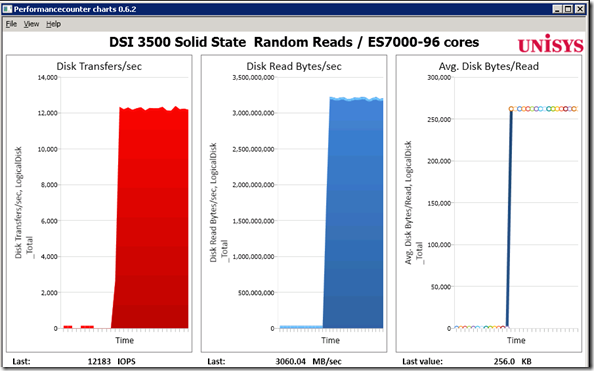
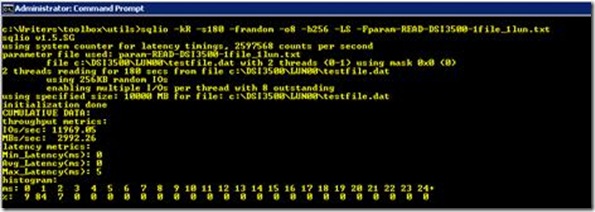
With two threads reading random IOs  the throughput goes up to an average of 2992 MB/sec, that’s an additional 784 MB/sec extra throughput!.

image

clip_image020

Test1c): Reading random 256KB IOs from 2x 10 GB files, single threaded each.

So adding a thread works great to get more throughput.  So very likely the 2nd option, adding a second file, with also it’s own thread will also  ramps up the throughput.

Command: sqlio -kR -s180 -frandom -o8 -b256 -LS -Fparam-READ-DSI3500-2files_1lun.txt

Content of parameter file:
c:\DSI3500\LUN00\testfile.dat 1 0x0 10000
c:\DSI3500\LUN00\testfile1.dat 1 0x0 10000

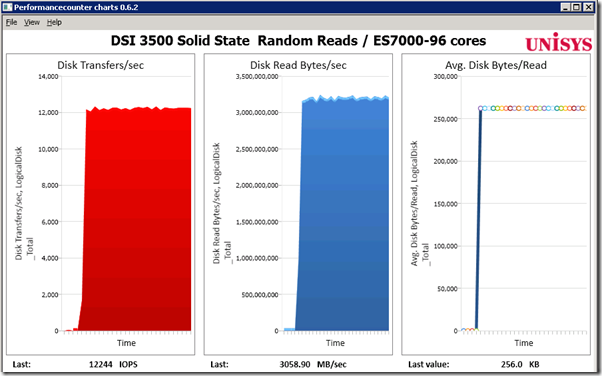
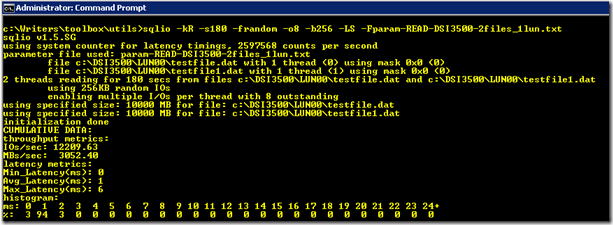
The throughput reading from 2 files in parallel increases to an average of 3052 MB/sec, which is an 844 MB/sec increase compared to single threaded single file access.

image

image

Test1d): Reading random 256KB IOs from 2x 10 GB files, two threads each.

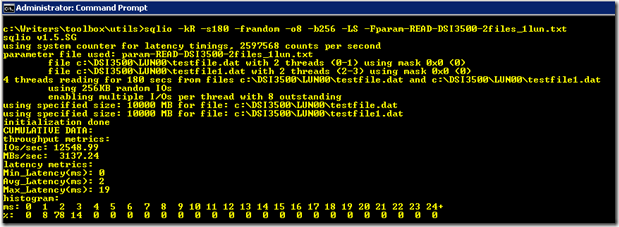
With 2 files reading with 2 threads each,  both the Disk transfers/sec and Disk Read Bytes/sec show flat lines !

that tells you that some limit is reached : the throughput peaks at 3142 MB/sec, which is the 8x 4 Gbit fiber throughput limit!

image

image

When checking the throughput on the fiber interface level, all 8 fiber interfaces are at 392 MB/sec Bandwidth each.

image

These quick tests with SQLIO show that we can get sustained a maximum throughput of  3 GByte/sec !

Test1e): Maximum number of Random 8 KB IOs.

The second part to check out is how many IO’s per second (IOPS) can be serviced.
SQL Server works with 8 KB pages and 64 KB extends and up to 4 MByte Read IOs during backup.
So lets check how many IOPS we can get with 8 KByte IOs.

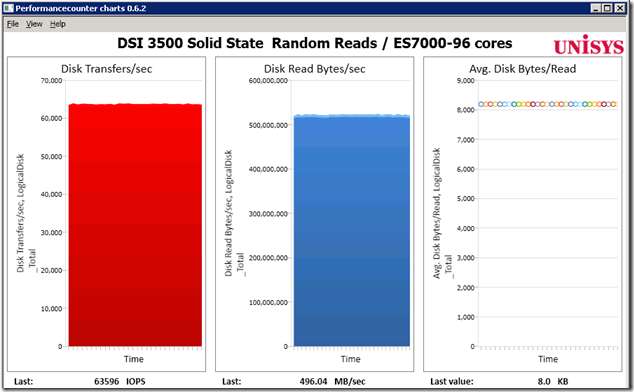
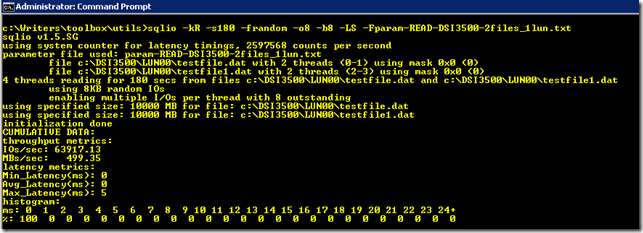
With 2 files/2threads : we a getting  63917 Random 8KB Reads.

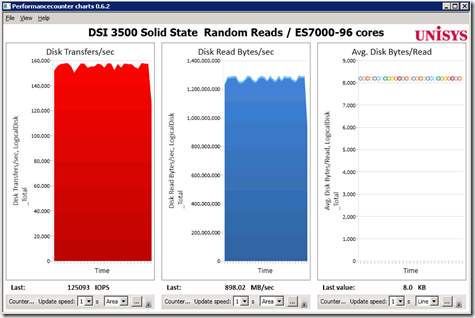
The flat lines in the graph below show that there’s some sort of bottleneck .

image

image

So the fastest way to find out if this is a Windows OS / file system limit or a hardware limit is to simply increase the number of files  in this case also:

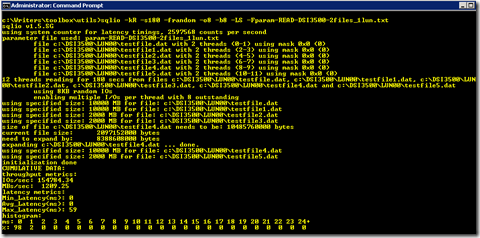
By specifying 6 files/ 2 threads each, the IOPS almost doubles, from 63917 to over 125000 !

image

image

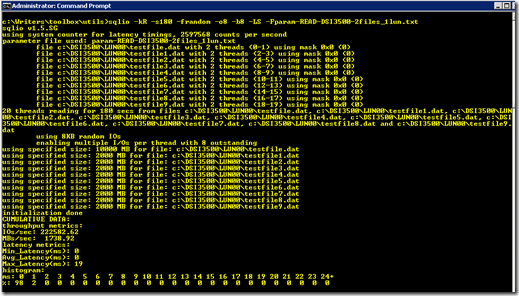
So let’s increasing the number of parallel files even further ;  with 10 files the number of IOs that we can squeeze out and service with a single Windows LUN

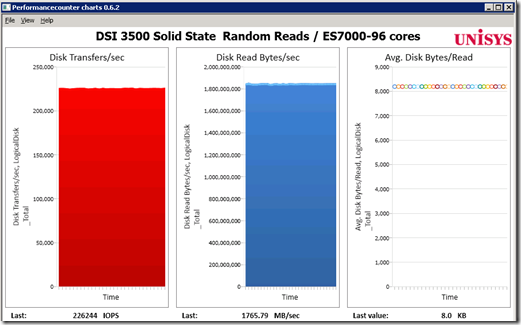
is more than 225000 IOPS!     We have 8 fibers connected,  so each is servicing (225000 / 8 =  )  28125 IOPS per HBA which isn’t near a hardware bottleneck.

image

image

So,  let’s add the second LUN and read from multiple files that are spread accross both luns.

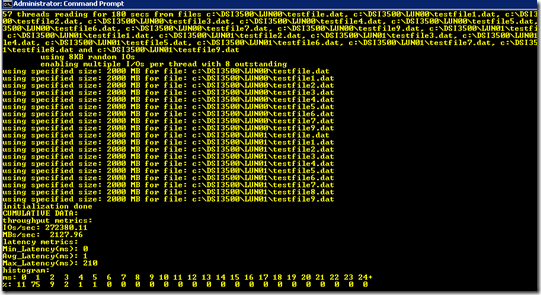
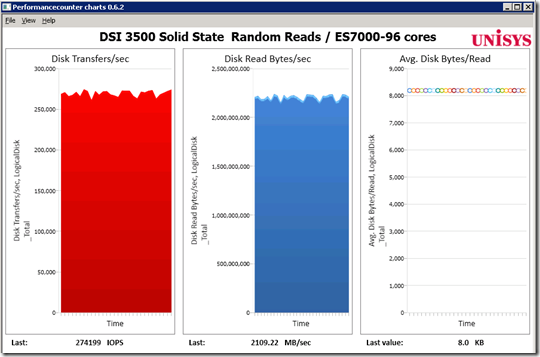
With multiple files spread over 2 LUNs the IO throughput increases to, on average, over 272000 and 86% of all IOs are still serviced within 1 millisecond!

This is way more than the 100000 IOPS that DSI lists on the specsheet.

image

image ho

The fiber interfaces are processing over 34000 IOPS each:

image

Conclusion:  the DSI 3500 specifications are very modest  and can be achieved without special tricks.  They can also be outperformed significantly by using 2 LUNS and accessing multiple files in parallel, so up to the next test and see how hard we can drive SQL Server !