The SQL 2008 Database backup compression feature (which was introduced as a SQL2008 Enterprise Edition only feature) will become available in the SQL2008 R2 Standard Edition also ( SQL 2008 R2 Editions). I’m using the compression feature for quite some time now and really love it; it saves significant amounts of disk space and increases the backup throughput. And when such a great feature is available I would recommend you to use it! In the following walk through I will show you some simple tricks to speed up the backup throughput.
How fast can we run a Full Backup on a single database with a couple of billion rows of data, occupying a couple hundred Gigabytes of disk space, spread across multiple Filegroups?
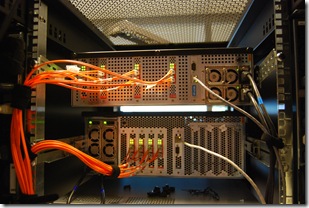
Of course your server will use some extra CPU cycles to compress the data on the fly and will use the maximum available IO bandwidth. For that purpose I tested on some serious hardware with plenty of both: a 96 core Unisys ES7000 model 7600R with 2 DSI Solid State Disk units who deliver a total of 6+ GB/sec IO throughput.
Getting started with Database Backup Compression
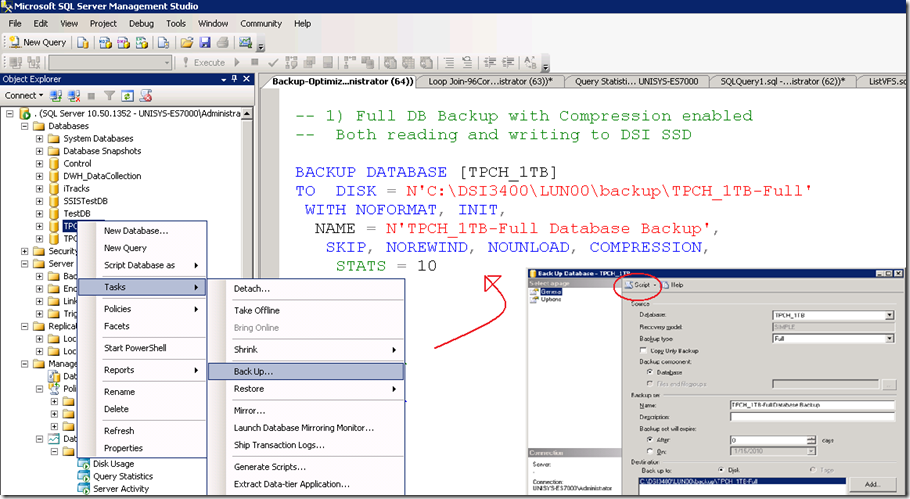
Database backup compression is disabled by default and it can be enabled through the SSMS GUI or by adding the word “COMPRESSION” to a T-SQL backup query.
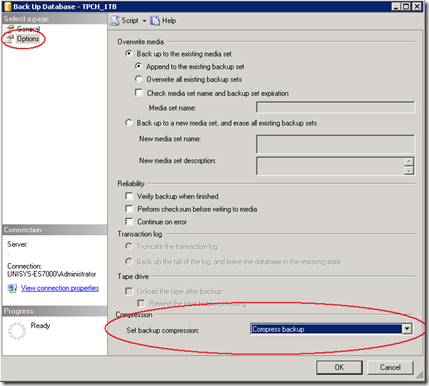
Through SSMS, when you -right click- the database which you would like to backup, under –Tasks- , -Back Up…-, -Options-, at the bottom , you will find the Compression feature. (see pictures)
After you have selected the “Compress Backup” option, click the –Script- Option to generate the TSQL statement. Please note that the word COMPRESSION is all you need to enable the feature from your backup query statement.
To enable backup compression feature for all your databases as the default option, change the default with the following sp_configure command:
GO
EXEC sp_configure backup compression default, '1';
RECONFIGURE WITH OVERRIDE
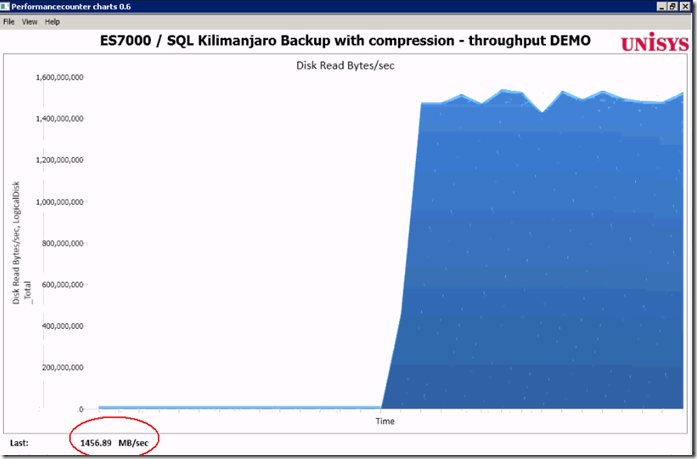
Step1 : Measure the “Out of the box” throughput
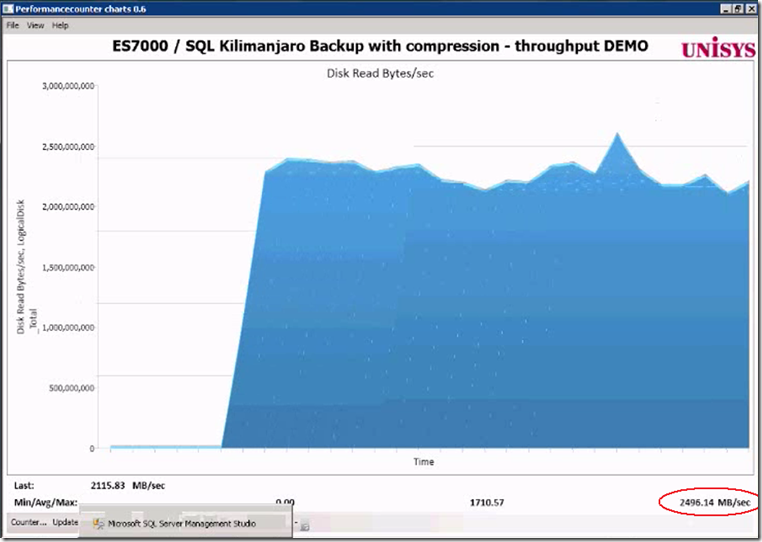
By running the above query, as a result, more than 1400 MByte/sec is read on average from both the DSI Solid State disks. That’s like reading all data from 2 full cd-rom’s each second. Not bad!
Waitstats
The SQL Waitstats show that the number 1 wait_type is BACKUPBUFFER.
The MSDN explanation for the BACKUPBUFFER wait_type is interesting: “the backup task is waiting for data or is waiting for a buffer in which to store data. This type is not typical, except when a task is waiting for a tape mount”. ehhh ok… since we are not using tapes , it means that this is not typical ! Let’s see what we can find out about the buffers.
Traceflag
To get more insights in the backup settings there are 2 interesting traceflags. With these traceflags enabled the actual backup parameters are logged into the SQL “Errorlog “.
DBCC TRACEON (3213, –1)
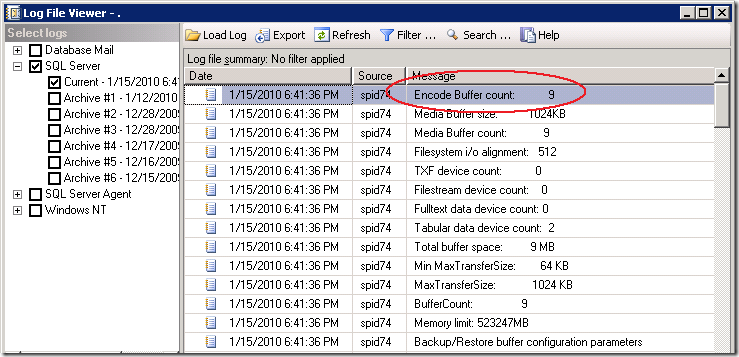
The Errorlog show that our backup was using 9 Buffers and allocated 9 Megabyte of buffer space.
9 MByte seems a relative low value to me to queue up all the destination backup file data and smells like an area where we can get some improvement, (especially since we have we have 16 x 4Gbit fiber cables and 6+ GigaByte/sec of IO bandwidth waiting to get saturated ;-) ).
Step2: Increase throughput by adding more destination files
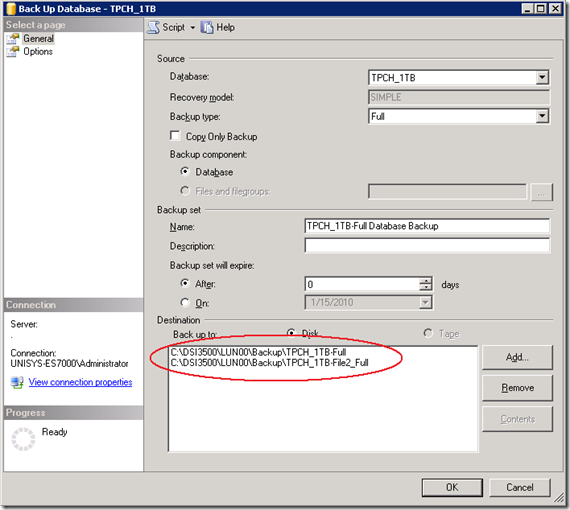
A feature that not many people know is the option to specify multiple file destinations to increase the throughput:
To add multiple Backup destination files in the query, add them like this:
DBCC TRACEON (3605, –1)
DBCC TRACEON (3213, –1)
BACKUP DATABASE [TPCH_1TB]
TO
DISK = N'C:\DSI3400\LUN00\backup\TPCH_1TB-Full',
DISK = N'C:\DSI3500\LUN00\backup\File2',
DISK = N'C:\DSI3500\LUN00\backup\File3',
DISK = N'C:\DSI3500\LUN00\backup\File4',
DISK = N'C:\DSI3500\LUN00\backup\File5',
DISK = N'C:\DSI3400\LUN00\backup\File6',
DISK = N'C:\DSI3500\LUN00\backup\File7',
DISK = N'C:\DSI3500\LUN00\backup\File8',
DISK = N'C:\DSI3500\LUN00\backup\File9'
WITH NOFORMAT, INIT,NAME = N'TPCH_1TB-Full Database Backup',
SKIP, NOREWIND, NOUNLOAD, COMPRESSION, STATS = 10
DBCC TRACEOFF(3605, –1)
DBCC TRACEOFF(3213, –1)
Result of adding 8 more destination files: the throughput increases from 1.4 GB/sec up to 2.2- 2.4 GB/sec.
That’s a quick win to remember!
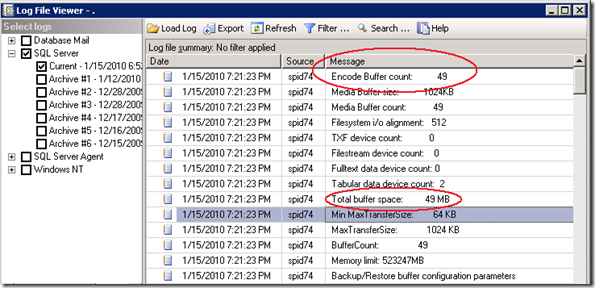
The SQL Errrorlog with the buffer configuration parameters shows that extra buffers are added automatically.
Step3 : Set Backup parameters options
The Backup/Restore buffer configuration parameters show some interesting parameters and values!
Time to start reading the ehh documentation! When you highlight the word ‘Backup’ and you hit <Shift-F1> you can read more on the topic; there are 2 Data Transfer Options listed :
BUFFERCOUNT and MAXTRANSFERSIZE.
BUFFERCOUNT : specifies the total number of I/O buffers to be used for the backup operation.
The total space that will be used by the buffers is determined by: buffercount * maxtransfersize.
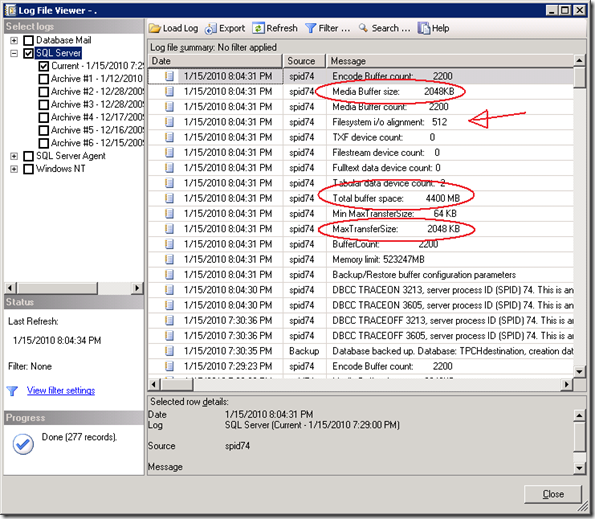
The output shows this is correct; with 49 buffers * 1024 KB = 49 MB total buffer space is in use.
MAXTRANSFERSIZE : specifies the largest unit of transfer in bytes to be used between SQL Server and the backup media.
The possible values are multiples of 64 KB ranging up to 4194304 bytes (4 MB). The default is 1 MB.
a 3rd option is listed under the section Media Set Options:
Trial and Measure approach
DBCC TRACEON (3605, –1)
DBCC TRACEON (3213, –1)
BACKUP DATABASE [TPCH_1TB]TO
DISK = N'C:\DSI3400\LUN00\backup\TPCH_1TB-Full',
DISK = N'C:\DSI3500\LUN00\backup\File2',
DISK = N'C:\DSI3500\LUN00\backup\File3',
DISK = N'C:\DSI3500\LUN00\backup\File4',
DISK = N'C:\DSI3500\LUN00\backup\File5',
DISK = N'C:\DSI3400\LUN00\backup\File6',
DISK = N'C:\DSI3500\LUN00\backup\File7',
DISK = N'C:\DSI3500\LUN00\backup\File8',
DISK = N'C:\DSI3500\LUN00\backup\File9'
WITH NOFORMAT, INIT,NAME = N'TPCH_1TB-Full Database Backup',
SKIP, NOREWIND, NOUNLOAD, COMPRESSION,STATS = 10
— Magic:
,BUFFERCOUNT = 2200
,BLOCKSIZE = 65536
,MAXTRANSFERSIZE=2097152
GO
DBCC TRACEOFF(3605, –1)
DBCC TRACEOFF(3213, –1)
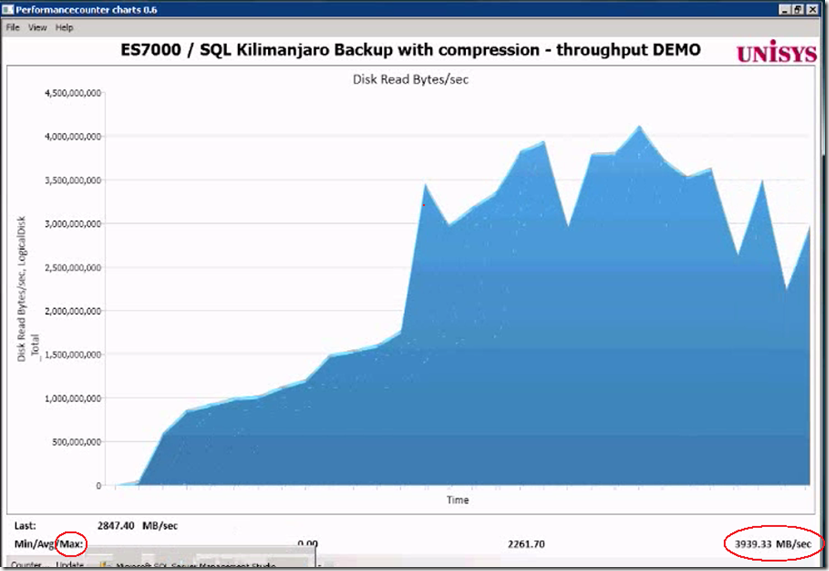
Result: the average throughput is more then doubled, and the maximum peak throughput is up to 3939 MB/sec !
BLOCKSIZE
An interesting observation is that I was more less expecting to see that by changing the BLOCKSIZE would also show up in the log, but it doesn’t .
Also the “Filesystem I/O alignment” value remained the same:
By coincidence, (I forgot to delete the backup files when adding some more destination files,) I found out that the blocksize value does make a change by looking at the error message:
Cannot use the backup file 'C:\DSI3500\LUN00\dummy-FULL_backup_TPCH_1TB_2' because
it was originally formatted with sector size 65536
and is now on a device with sector size 512.
Msg 3013, Level 16, State 1, Line 4
BACKUP DATABASE is terminating abnormally.
By specifying a large 64KB sector size instead of the default 512 bytes typically shows an 5-6% improvement in backup throughput.
BACKUP to DISK = ‘NUL’
To estimate and check how fast you can read the data from a database or Filegroup there is a special option you can use to backup to: DISK = ‘NUL’. You only need 1 of those !
FILEGROUP = 'SSD3500_0',
FILEGROUP = 'SSD3500_1'
TO DISK = 'NUL'
WITH COMPRESSION
, NOFORMAT, INIT, SKIP, NOREWIND, NOUNLOAD
, BUFFERCOUNT = 2200
, BLOCKSIZE = 65536
, MAXTRANSFERSIZE=2097152
Wrap-Up
Backup compression is a great feature to use. It will save you disk capacity and reduce the time needed to backup your data. SQL can leverage the IO bandwidth of Solid State storage well but to achieve maximum throughput you need to do some tuning. By adding multiple backup destination files and specifying the BUFFERCOUNT, BLOCKSIZE and MAXTRANSFERSIZE parameters you can typically double the backup throughput, which means reducing the backup time-taken by half!

