SQL under the hood (Part 1): Monitoring Current- & Pending Disk IOs
Do you know how many disk IO’s are being processed by your SQL Servers at this very moment? And how many of them are pending, waiting to be serviced? Which databases are the top IO consumers and which queries are actually creating the majority of the IO load? In this blog I will focus on the upper part of the IO chain and show you how to monitor the IOs from within SQL Server itself.
Pending Disk IOs
You probably have seen this message in a SQL Error log before: “SQL Server has encountered xxx occurrence(s) of I/O requests taking longer than 15 seconds to complete on file…”
This indicates you may have some (CPU drift going on, or indeed some-) serious Disk IO pressure; waiting 15 seconds or more for an queued IO to complete is a very long time… But what about all other IO’s that take somewhere between 0 and 14.99 seconds to complete?
There’s a document published that reveals many tricks to look under the hood of SQLServer; Troubleshooting Performance Problems in SQL Server 2008
I enhanced one of the queries a little bit, that actually lists the pending IOs from a SQL perspective in such a way that it will show on a per database- and physical file name basis how long IO’s are actually pending.
Based on query from the Troubleshooting Perf. Probl.in SQL Server 2008:
http://download.microsoft.com/download/D/B/D/DBDE7972-1EB9-470A-BA18-58849DB3EB3B/TShootPerfProbs2008.docx
*/
SELECT db.name AS database_name
, mf.name AS file_name
, mf.physical_name
, vfs.io_stall
,t2.io_pending_ms_ticks as IO_pending_millisec_ticks
,t2.scheduler_address
,sched.scheduler_id
FROM sys.dm_io_virtual_file_stats(NULL, NULL)vfs
JOIN sys.dm_io_pending_io_requests as t2
ON vfs.file_handle = t2.io_handle
JOIN sys.databases db
ON vfs.database_id = db.database_id
JOIN sys.master_files mf
ON vfs.database_id = mf.database_id
AND vfs.file_id = mf.file_id
JOIN sys.dm_os_schedulers sched
on t2.scheduler_address = sched.scheduler_address
ORDER BY io_pending_ms_ticks DESC
SQL Pending IOs Query Output
The sample query output below shows that even a simple table scan operation creates queuing on the database file level of several hundred milliseconds.
This is very valuable information when you need to discuss IO response timings with the storage department since file access timings and queued IOs will cause very little confusion.
But there is more to check; to get a complete picture you should also know how many IOs are actually being processed by each of these database files. (Before thinking of enhancing the above query,) there’s an option built-in into SQL that addresses this graphically; the Activity Monitor.
SSMS SQL Activity Monitor
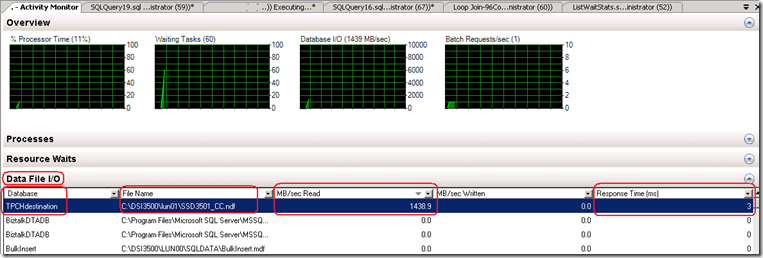
To find out quickly which databases are “Hot” and which are “Not”, you may have a look at the SSMS Activity Monitor. The Activity monitor will show you in by default after every 10 seconds, the real-time Read & Write Megabytes Data File I/O statistics for all the database- and log files. Besides the effective throughput, the Activity Monitor also reports the IO response time for every database- and log file. (if needed, you may change the refresh interval to 1 second; just right-click [Overview] and select [Refresh Interval]).
The lower part of the Activity monitor; allows you to also identify the source of the disk activity; just have a look at the “Recent Expensive Queries” part from the Activity monitor , or
select a SSMS build-in report like ‘Top queries by Total IO’.
Physical Reads/sec : Indeed , this value is direct related to the Windows Perfmon Logical and Physical Disk counter : Disk Reads/Sec.
Logical Writes+Reads/sec : multiplied by 8192 , this values represents the effective MBytes/sec processed.
You could also download queries like Adam Machanic’s “who_is_active” SP to have a real-time overview of physical Reads, Reads and Writes which will also pull the deltas on various metrics if you enable it by changing the @DELTA_INTERVAL TINYINT from 0 into 1. (Thanks for pointing me to this one André). (Please note the SQL2008R2 Nov CTP will only return any IO values when MDOP is set to 1 on a multi core system,thanks for the tip, Thomas ;-))
Windows Performance Monitor
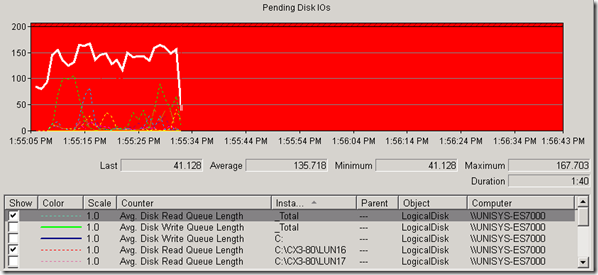
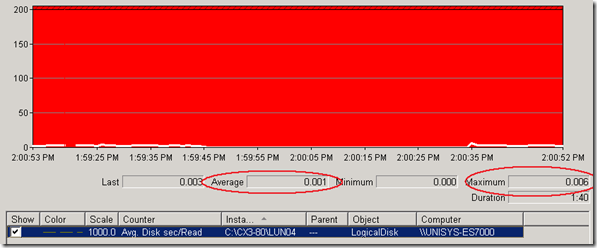
With this information handed over by SQL we already have a pretty good picture of the Disk IO throughput and response timings. The next part of the IO chain we have to investigate is look at the IOs from the Windows Operation system perspective. Best place to start is to fire up the Windows Performance Monitor (perfmon) and select the “Logical disk” object counters like the “Average Read- and Write Queue length”. If indeed the disks are under severe load the disk queues on a per disk/LUN basis will also show hundreds of Pending IOs. To validate if the IO response timings are showing similar figures as SQL , select the “Avg. Disk Seconds/Read and – Write” counters. These values are measured in milliseconds. The pictures below show an total average disk Read Queue length of around 150 queued IOs with an average response time of about 1 millisecond each, which means pending IO values could be as high as 150 milliseconds on a SQL database file level.
Wrap up
The SQL DMV’s and the SSMS Activity Monitor allow you to monitor and quickly identify where the SQL IO workload is coming from, how long IOs are pending before being serviced and which database & log files are actually “Hot”. In the part 2 I will show you how to snapshot the virtual database- and log file IO statistics and start building an accurate IO workload profile.


