SQL2008 R2 DCE on a 96 core Unisys ES7000 server with DSI Solid State storage: Bulk Inserting 1 Terabyte within 10 minutes
Hopefully you have seen the high-speed data loading demo live over the last 1.5 years at some SQL Server conference? I remember demoing it the first time –live- with Thomas Kejser at the European SQLPass 2009 conference during the opening keynote to show the 64+ Core support in SQL2008 R2. But for those of you who haven’t, hereby an impression of what data loading throughput you can achieve on a 96 core Unisys ES7000 Server with 2 DSI Solid State units attached (which we codenamed the SQL Powerrack); it’s running 3 times faster than our SQL 2008 ETL World Record of 1 TB within 30 minutes. A small movie tells you more than a thousand words, so watch how 96 flat files are being bulk inserted simultaneous into a single SQL database and read also how to get maximum speed out of bulk inserting yourselves.
 shelves.")

SQL2008 R2 Datacenter Edition
With the official RTM build of SQL Server 2008 R2 Data Center Edition the overall throughput is even slightly higher than the CTP1 version that we used at the European Pass (2009) conference; imagine… bulk inserting over 16 million LineItem rows/sec with 16 columns of data each… (16 million…that’s roughly the number of citizens over here in the Netherlands..)
Reading the 96 flatfiles with a sustained read speed over 2000 MB/sec and inserting it into the database with over 1700 MB/sec… definitely some numbers to remember!

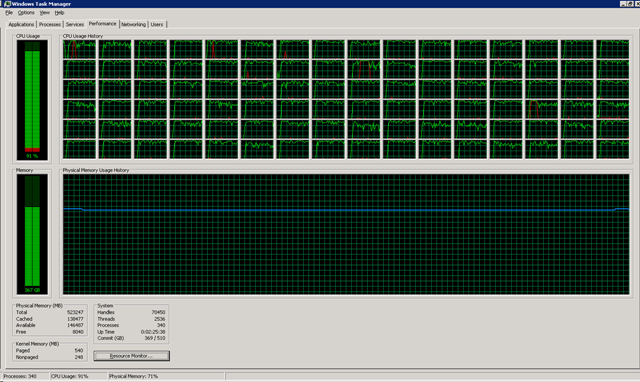
The Windows Task Manager looks like this when starting all 96 tasks at the same time:

Optimizations
With the incredible fast Solid State storage units from DSI hooked up to our 96 core Unisys ES7000 server very little tuning is needed to achieve these throughput numbers;
the only 3 things to take care of are:
1) Configure multiple Windows LUN’s on the SSD devices. (With MPIO enabled at approx. 140000 IOPS a LUN gets saturated).
2) Use 96 database files/24 Filegroups to prevent PFS contention becoming a bottleneck
3) Use the “Harakiri” Stored Procedure to check that only 1 Bulk Insert task gets assigned to each SQL Scheduler.
The SQLPowerrack @ Work
I was reading through my old notes from the SQL2008 ETL World Record and noticed that we ran with 56 parallel streams, each writing out the heavy-weight LineItem file data with approx. 10-12 MB/sec. Currently, with SQL2008R2, the write speed is up to 54-58 MB/sec per stream with 96 parallel streams. Quite a difference I would say! Also the disk write IO Response time decreased significantly, from 23-28 milliseconds to 11 milliseconds.

SQL Waitstats
When SQL is processing gigabytes of disk IO’s each second it’s worth it to take a snapshot of the sys.dm_os_wait_stats and sys.dm_os_latch_stats DMV to see where SQL is waiting for.
A 1 minute snapshot while running at full speed shows that SQL’s no.1 wait is to read the data from the flat files. With 82% of the wait time.
But, if you calculate the average wait time, you’ll see that it’s waiting for only 0.3 milliseconds for an file access IO while reading sustained 2GB/sec from SSD (and also writing over 1700MB/sec to SSD at the same time) is an amazing value also!

A 1 minute snapshot of the the sys.dm_os_latch_stats show that waits for memory buffer page synchronization requests take on average 1.7 msec.
![]()
The Work Queue
The Work queue contains primarily a list of all the files that need to be bulk inserted into the database and also its target destination table. Once a task is completed all kind of
statistics, like datetime stamps, duration, IO information, CPU time, CPU/scheduler ID etc., are written into the table also to verify afterwards. (The table definition is listed below).

Preventing Scheduler contention
Next, basically the only tuning we do is to check if a SQL scheduler is already allocated to another Bulk Insert task, and if so, to pick another one.
By default, a new session is assigned to any available scheduler in a round robin fashion way, so when for example 2 (or more) Bulk insert tasks reside on the same scheduler, they will stay on that scheduler and have to share the CPU ticks till their both done bulk inserting. This might not be the most effective way to distribute the workload across a multi core server. So if you would prevent this from happening you can apply TCP port mapping and soft numa (like we did with the ETL WR) or … keep reading!
Starting 96 Bulk Inserts at the same time
For testing purposes, we wrote 2 batch files that allows you to start as many parallel bulk insert tasks as you like (:
For example to start 96 parallel Bulk Inserts, just type: “Spawnmany Bulk2 96”.


Optimized Bulk Loading routine
The heart of the bulk loading routine we use is a Stored Procedure that picks a task from a work queue (sp_get_work), checks for a free scheduler and then waits for the “start=1” signal from the Spawnmany.cmd file to continue. Once it’s done with each of the bulk inserting tasks, the session duration and statistics are updated (sp_end_work) and it will check the queue if there’s more work to be done.
SP Worker_Bulk_Harakiri
GO
/****** Object: StoredProcedure [dbo].[Worker_Bulk_Harakiri] ******/
SET ANSI_NULLS ON
GO
SET QUOTED_IDENTIFIER ON
GO
CREATE PROCEDURE [dbo].[Worker_Bulk_Harakiri]
AS
SET NOCOUNT ON
DECLARE @my_scheduler INT
SELECT @my_scheduler = scheduler_id
FROM sys.dm_exec_requests
WHERE session_id = @@SPID
UPDATE scheduler_use
SET session_id = @@SPID
WHERE session_id IS NULL
AND scheduler_id = @my_scheduler
/* We landed on a scheduler that is in use */
IF @@ROWCOUNT = 0 BEGIN
RAISERROR ('Scheduler in use', 16, 111)
RETURN
END
DECLARE @start BIT = 0
WHILE @start = 0 BEGIN
SELECT @start = start FROM Control..ready
WAITFOR DELAY '00:00:01'
END
DECLARE @target NVARCHAR(MAX)
DECLARE @assignment NVARCHAR(MAX)
DECLARE @partition NVARCHAR(MAX)
DECLARE @work_id INT
EXEC [Control].dbo.sp_get_work 'BULK'
, @work_id OUTPUT, @assignment OUTPUT, @target OUTPUT
WHILE @work_id IS NOT NULL BEGIN
DECLARE @sql NVARCHAR(4000)
PRINT @target
PRINT @assignment
SET @sql = 'BULK INSERT ' + @target
+ ' FROM ''' + @assignment + ''''
+ ' WITH (
CODEPAGE = ''OEM'', DATAFILETYPE = ''CHAR'', TABLOCK'
+ ', ROWTERMINATOR =''|\n'', FIELDTERMINATOR = ''|'')'
RAISERROR (@sql, 10, 1) WITH NOWAIT /* print the message immediately */
EXEC sp_executesql @sql
IF @@ERROR <> 0 BEGIN
RETURN /* Do not mark he work as ended if error occurred */
END
EXEC [Control].dbo.sp_end_work @work_id
/* Get the next work item */
EXEC [Control].dbo.sp_get_work 'BULK'
, @work_id OUTPUT, @assignment OUTPUT, @target OUTPUT
END
GO
Keeping track of the SQL scheduler usage
The Scheduler_use table should contain a row entry for each CPU available in your system. In our case we will use all 96 available cores so the table contains 96 rows (insert the values 0..95 for scheduler_id). To find out the number of CPU’s quickly use:
“SELECT cpu_count AS [Logical CPU Count] FROM sys.dm_os_sys_info; “ or check with “master..xp_msver ProcessorCount” .
If you want to “hard” limit the maximum number of parallel bulk insert tasks the table should contains less.
GO
— Object: Table [dbo].[scheduler_use]
SET ANSI_NULLS ON
GO
SET QUOTED_IDENTIFIER ON
GO
CREATE TABLE [dbo].[scheduler_use](
[scheduler_id] [int] NULL,
[session_id] [int] NULL
) ON [PRIMARY]
GO

The Control Database
We created a separate Control Database for the overall housekeeping, like picking jobs from the work queue and keep track of the start flag status in the ready table:
GO
/****** Object: Table [dbo].[ready] ******/
SET ANSI_NULLS ON
GO
SET QUOTED_IDENTIFIER ON
GO
CREATE TABLE [dbo].[ready](
[start] [bit] NULL
) ON [PRIMARY]
GO
The Work_queue table definition:
GO
/****** Object: Table [dbo].[work_queue] ******/
SET ANSI_NULLS ON
GO
SET QUOTED_IDENTIFIER ON
GO
CREATE TABLE [dbo].[work_queue](
[work_id] [int] NOT NULL,
[group] [nvarchar](128) NULL,
[priority] [int] NOT NULL,
[assignment] [nvarchar](max) NULL,
[partition] [nvarchar](max) NULL,
[target] [nvarchar](max) NULL,
[is_active] [bit] NOT NULL,
[is_done] [bit] NOT NULL,
[start_date] [datetime] NULL,
[end_date] [datetime] NULL,
[time_ms] [int] NULL,
[logical_reads] [int] NULL,
[reads] [int] NULL,
[writes] [int] NULL,
[cpu_time] [int] NULL,
[scheduler_id] [int] NULL,
[cpu_id] [int] NULL,
[node_id] [int] NULL,
[session_id] [int] NULL,
[user_name] [nvarchar](128) NULL,
[create_date] [datetime] NOT NULL
) ON [PRIMARY]
GO
SP sp_get_work
This stored procedure checks the work-queue for a new work items to process and if a priority is assigned to it. The is_active flag is set when
an item is picked.
GO
/****** Object: StoredProcedure [dbo].[sp_get_work] ******/
SET ANSI_NULLS ON
GO
SET QUOTED_IDENTIFIER ON
GO
CREATE PROCEDURE [dbo].[sp_get_work]
@group NVARCHAR(128) = NULL /* The group to get*/
, @work_id INT = NULL OUTPUT /* the work_id assigned */
, @assignment NVARCHAR(MAX) = NULL OUTPUT /* The description of the work to do */
, @target NVARCHAR(MAX) = NULL OUTPUT /* The target to operate on */
, @partition NVARCHAR(MAX) = NULL OUTPUT /* The partition to work on */
AS
/*
Date: 2008-03-11
Author: tkejser@microsoft.com
Purpose: Get a work item from the work_queue in @group
*/
SET NOCOUNT ON
/* Gather some data about the connected user */
DECLARE @reads INT, @writes INT, @cpu_time INT, @logical_reads INT
DECLARE @node_id INT, @scheduler_id INT, @cpu_id INT
SELECT @reads = er.reads
, @writes = er.writes
, @logical_reads = er.logical_reads
, @cpu_time = er.cpu_time
, @scheduler_id = er.scheduler_id
, @node_id = s.parent_node_id
, @cpu_id = s.cpu_id
FROM sys.dm_exec_requests er
INNER JOIN sys.dm_os_schedulers s
ON er.scheduler_id = s.scheduler_id
WHERE session_id = @@SPID
/* get the work */
DECLARE @my_work_id INT
DECLARE @my_assignment NVARCHAR(MAX)
, @my_target NVARCHAR(MAX)
, @my_partition NVARCHAR(MAX)
UPDATE TOP(1) work_queue WITH (TABLOCKX)
SET is_active = 1
, [start_date] = GETDATE()
, @my_work_id = work_id
, @my_assignment = assignment
, @my_target = [target]
, @my_partition = [partition]
, reads = @reads
, writes = @writes
, cpu_time = @cpu_time
, logical_reads = @logical_reads
, session_id = @@SPID
, [user_name] = USER_NAME()
, cpu_id = @cpu_id
, scheduler_id = @scheduler_id
, node_id = @node_id
WHERE is_active = 0
AND is_done = 0
AND ([group] = @group OR @group IS NULL)
AND priority = (SELECT MAX(priority) /* Get the highest priority item */
FROM work_queue
WHERE is_active = 0
AND is_done = 0
AND ([group] = @group OR @group IS NULL))
/* Provide a message if nothing to do */
IF @my_work_id IS NULL BEGIN
PRINT 'No work in queue for group = ' + ISNULL(@group, '')
END
/* return the values */
SELECT @work_id = @my_work_id
, @assignment = @my_assignment
, @target = @my_target
, @partition = @my_partition
GO
SP end_work
When the task is finished the “is_done” flag gets set and the session run details are written out to the queue.
GO
/****** Object: StoredProcedure [dbo].[sp_end_work] ******/
SET ANSI_NULLS ON
GO
SET QUOTED_IDENTIFIER ON
GO
CREATE PROCEDURE [dbo].[sp_end_work]
@work_id INT /* The work to mark as ended */
AS
/*
Date: 2009-03-11
Author: tkejser@microsoft.com
Purpose: Marks the work in the queue as finished
*/
SET NOCOUNT ON
DECLARE @reads INT, @writes INT, @cpu_time INT, @logical_reads INT
/* gather some information about the session ending */
SELECT @reads = er.reads
, @writes = er.writes
, @logical_reads = er.logical_reads
, @cpu_time = er.cpu_time
FROM sys.dm_exec_requests er
WHERE session_id = @@SPID
UPDATE work_queue
SET is_done = 1
, is_active = 0
, end_date = GETDATE()
, time_ms = DATEDIFF(ms, [start_date], GETDATE())
, cpu_time = @cpu_time – cpu_time
, logical_reads = @logical_reads – logical_reads
, reads = @reads – reads
, writes = @writes – writes
WHERE work_id = @work_id
GO
That’s all there is to it! Or… maybe there’s something else to take into account when writing out data at high speed to SSD storage. What about the SSD “wearing effect” or housekeeping operations that are going on in the background to spread the write load evenly across all the chips ?
The DSI Effect
Until a couple of weeks ago when I was investigating performance logs from a customer who was using these entry level PCI-E SSD cards, I never realized that the DSI Solid state units which I have been stress testing very hard for months (actually, since January 2009 already) do not show any noticeable form of write throughput degradation or even latency increase under high pressure, not even when hammering them for hours. and I wrote Petabytes of data to them by now. Reason: the backend write capacity outperforms the maximum load that the front-end ports can ever provide. Lucky me! (However when your budget is a bit tight and only allows you to buy some PCI-E SSD cards, make sure you check the Virtual File Stats (sys.dm_io_virtual_file_stats) to see how much data has been written to tempdb or any of the database files that you would like to store on SSD, and predict the write IO workload on an hourly or daily basis).

Additional Readings
To read in more detail about the products we use or all ins-and-outs on bulk inserting data, here are some links:
- The Unisys ES7000 Server, Model 7600R,
with 16 x Intel 6-core X7460 CPU’s (= 96 cores) and 512 GB RAM (Up to 1 TB) - Dynamic Solutions SSD Storage Solutions: http://www.dynamicsolutions.com/dsi3600
- SQL Powerrack: www.sqlpowerrack.com
- The Data Loading Performance Guide:
http://msdn.microsoft.com/en-us/library/dd425070.aspx - The 2008 ETL World record: http://msdn.microsoft.com/en-us/library/dd537533.aspx
Wrap-up
From the very early builds of SQL Server 2008 R2 with 64+ core support enabled it has been very much fun to drive 96 cores Unisys ES7000 servers to their limits;finally a Windows app that can benefit from so many cores! But even more important, SQL 2008 R2 has always been running smoothly and never failed. It’s also great to see how SQL Server benefits from the sustained low latency disk IO’s for both reading and writing at the very high speeds that the DSI SSD units provide. When you are in need of a high performance system that has to move Terabytes of data around on an hourly- or daily basis, consider the Unisys SQL Powerrack offering. Or just remember these numbers: loading 1 Terabyte of data from flat files into SQL Server 2008 R2 within 10 minutes, that’s like reading more than 2 Gigabyte a second and writing almost 1750 Megabyte/sec !;-)

3 Responses Leave a comment
I vote this page the Best blog of 2011, Congrats from me, you had the best articals 2 year2 in a row, keep up the good work.
Wishing you the best, Happy new year and Merry Christmas
Sincerely
Nik (2011-12-25)
I know this article is old… but are there any details about the data being loaded? (how the load data was created, target tables, etc.) Or am I missing something?
Hi Curtis,
for benchmarking I (still) use the lineitem files from the TPCH dataset, generated with a utility called dbgen.exe from http://www.tpc.org/tpch/;
this generates files with random data. If this type of data loads fast, then real world data will be even faster!