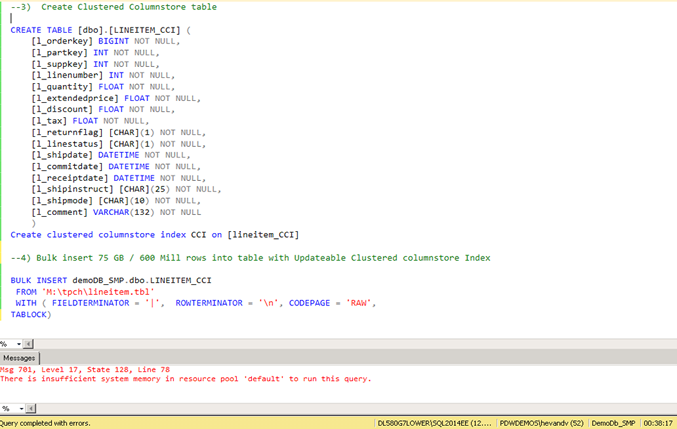
SQL2014EE ‘Insufficient System Memory’ message
While preparing a data load demo for my presentation at SQLSaturday 317 in Oslo I experienced an hickup with SQL2014 EE: although the server in use for the comparison has 200+GB of RAM assigned to a freshly installed SQL instance, the Bulk inserting command to load a ~75 GByte flat file into an newly created Clustered Columnstore Indexed (CCI) table failed with the following error message:
Msg 701, Level 17, State: 128, line xx
There is insufficient system memory in resource pool ‘default’ to run this query.
There are a lot of posts out there on this specific message but I didn’t find good insights, so hopefully my attempt helps you to find a resolution: try and execute the ‘ALTER RESOURCE GOVERNOR RESET STATISTICS’ command and check again; for me this was sufficient to clear the message an load the data successfully afterwards. If your interested in digging a bit deeper into the Resource Governor values and settings, continue reading!
The test commands:

The Message in the SQL Server Log is slightly different than the one returned in SSMS:
Error: 701, Severity: 17, State: 128
There is insufficient system memory in resource pool ‘default’ to run this query.
Thinking about this message for a minute, my first thought was, well this could make sense; the default settings of SQL Server will assign a maximum of 25% memory granted to a query. Would it be the case that we simply don’t have enough memory assigned (25% of 200 GB == 50GB) to run this task? But this isn’t SQL-alike behavior: you would expect worst case, that SQL Server would start to swap data out to disk and report a lot of time spend on some sort of waitstat as the new ‘COLUMNSTORE_BUILD_THROTTLE’ instead?
So just to look for an easy fix, I enabled the Resource Governor and increased the Memory Grant Percentage to 50% via the GUI, followed by 60%, 80% and finally with the value set to 95% the bulk insert task completed and loaded the 75 GByte of data from flatfile. This ‘trial & error’ approach made me feel a bit uncomfortable; do I really need 2.5x the amount of memory? I never experienced any such problem with direct data loads of easily 20x this size directly into CCI tables in SQL Server APS. So time to dig deeper…

So, to run some investigations I reverted the RG settings back to the default 25% and disabled it. Then noticed that the DMV’s related to the Resource Governor have been enhanced significant in SQL2014; new counters like ‘read_bytes_total’ and ‘write_bytes_total’ have been added to the sys.dm_resource_governor_resource_pools dmv. (for a full description click here).
Snapshotting the Resource Governor Resource Pool values
To take a quick snapshot of the current values, just copy them into a temp table:
--Snapshot RG Resource Pool stats:
USE tempdb
SET NOCOUNT ON
IF OBJECT_ID('tempdb.dbo.__RG_resource_pools') IS NOT NULL BEGIN
    DROP TABLE tempdb.dbo.__RG_resource_pools
END

SELECT GETDATE() as Date, *
INTO tempdb.dbo.__RG_resource_pools
FROM sys.dm_resource_governor_resource_pools
and then the fun part begins; watching the various values to increase over time is the interesting part , which values actually correlate best with the bulk insert task? So I ended up primairly looking at the delta values of following fields;
List the Resource Pool delta values over time
SET NOCOUNT ON
SELECT
    b.Date as Snapshot_Taken,
    DATEDIFF(ss,b.Date,GETDATE()) As Seconds_Delta,
    a.name AS RG_Pool_name,
    a.statistics_start_time as Last_Statistics_Update_start_time,
    (a.read_bytes_total  - b.read_bytes_total)/1024/1024/1024 AS Read_GB_Delta,
    (a.write_bytes_total - b.write_bytes_total)/1024/1024/1024 AS Write_GB_Delta,
    --a.used_memgrant_kb - b.used_memgrant_kb AS Used_memgrant_kb_delta,
    a.cache_memory_kb - b.cache_memory_kb AS Cache_memory_kb_Delta,
    a.total_memgrant_count - b.total_memgrant_count AS Total_memgrant_count_Delta,
    (a.max_memory_kb/1024/1024) AS Max_Mem_GB,
    (a.used_memory_kb/1024/1024) AS Used_Mem_GB

FROM sys.dm_resource_governor_resource_pools a
JOIN tempdb.dbo.__RG_resource_pools    b ON a.name = b.name
Query Output
The DMV snapshot nicely shows the ‘Read_GB_delta’ column representing the size of the flat file being processed, and the ‘Write_GB_delta’ column shows the size of the created CCI cq. data written to disk!
![]()
What is really interesting here is that the input part, the 74 GB flatfile size, has been assigned to the Internal pool, where resource consumption is not restricted in any form, and the actual CCI data, 25 GB has been allocated to the default pool. 25 GB is a value which should have fit easily into the Default Group in the first place, right? So what happened?
But then, looking at the other columns I noticed that the ‘statistics_start_time’ value hadn’t changed when reverting the values to its original values. According the article this value represents ‘The time when statistics was reset for this pool.’, so I gave it a try and manually reset the RG statistics;
ALTER RESOURCE GOVERNOR RESET STATISTICS
This indeed updated the statistics_start_time value, so I changed the value in my query above to : ‘Last_Statistics_Update_start_time’ to make it easier to interpret.
After the reset, the data loading completed successfully, also with the default settings , so problem solved!
Doublecheck
Just to validate that SQL Server2014EE will indeed throttle but still complete the CCI build process properly, as a test I lowered the Memory Grant % from 25% for the Default group down to as little as 5% (== ~max. 10GB) and started the bulk insert one more time;
ALTER WORKLOAD GROUP [default] WITH(request_max_memory_grant_percent=5)
ALTER RESOURCE GOVERNOR RESET STATISTICS
ALTER RESOURCE GOVERNOR RECONFIGURE
Surprisingly after the direct load into the CCI table completed succesfully, not a sign of ‘COLUMNSTORE_BUILD_THROTTLE’ or any of the fancy new waitstats there; just the regular data loading ones!
 .
.
Wrap-up
To overcome the ‘There is insufficient system memory in resource pool ‘default’ to run this query. ’ error message please check the sys.dm_resource_governor_resource_pools dmv values. Before increasing the Max. Memory Grant setting first give it a try to update the the Resource Governor statistics with the ‘ALTER RESOURCE GOVERNOR RESET STATISTICS’ command.
(And as always.. please let me know your findings!
– Henk)

6 Responses Leave a comment
Greetings Henk,
Have experienced this twice in projects. For the non clustered variant. I chose using partitioning as a better choice for one of them because I did not want to risk side effects from allowing too high memory use. On the other, setting max memory temporarily to 90% solved the problem. The first time it scared me away from using the column store at all, I did not want to introduce this risk to the client. Maybe this needs a best practice whitepaper in the future.
Thanks Gorm,
next time you see this message try the ‘ALTER RESOURCE GOVERNOR RESET STATISTICS’ command…
will pass on the whitepaper request.
-Henk
Nice stuff, Henk!
Basically that issue has had nothing to do with a Columnstore but with RG stats.
As Gorm, I guess the most people not playing with APS are definitely choosing partitioning in order to get reasonable maintainability as well as the Segment Clustering.
Hi Niko,
indeed, symptoms vs potential root cause…
hi dear Henk;
This is Lida from Iran. I write this comment to thank you due to :
ALTER WORKLOAD GROUP [default] WITH(request_max_memory_grant_percent=5)
ALTER RESOURCE GOVERNOR RESET STATISTICS
ALTER RESOURCE GOVERNOR RECONFIGURE
it was so helpful. I really appreciate it.
good luck!
Nice one Henk. You just saved my day. I spent a lot of time trying to figure out why I am getting Insufficient Memory errors in one environment but not in the other with the same server specs. Because if this post, I found out that one environment has the Resource Governor turned on.
Thank you. Keep writing useful article! All the bests.