Introduction
The Microsoft Analytics Platform System (APS) comes with a very powerful feature that’s called Polybase. Polybase has been introduced over 2.5 years ago and extended ever since to integrate the world of structured and unstructured data, either on-premise as well in the Microsoft Azure cloud. The concept is simple: within an APS database you create an ‘External’ table that points to data located in a hadoop hdfs file system or in Windows Azure Blob Storage enabling hybrid data access. It allows you to seamlessly import, export & access data even with a small pipeline; in this hybrid world moving data around is a point of attention where data compression plays a significant role to minimize time needed to crawl through data and turn it into insights.
Below an overview of one of the most powerful Polybase options: the ‘CREATE EXTERNAL TABLE AS SELECT’ (CETAS) which allows you to export data in a compressed format, saving time & bandwidth.
Configuring Polybase – the basics
By default Polybase is disabled on an APS appliance. All the ins & out are described in the APS online documentation but just to give you an idea of the few steps needed, hereby a quick walkthrough.
Multiple flavors and versions of Hadoop are supported by APS Polybase, even HDP running on Linux. For the tests I have in mind for this post we will stick with the setup on how to store and query data from Microsoft Azure Blob Storage (WASB): with SP_configure ‘Option 4’ you enable integration with HDInsight on Analytics Platform System (version AU2) (HDP 2.0), Hortonworks (HDP 2.0) for Windows Server and Azure blob storage on Microsoft Azure (WASB[S]).
EXEC sp_configure 'Hadoop Connectivity', 4;
RECONFIGURE;
GO

Secondly we have to add an Azure storage account to the core-site config file that resides on the APS Control node in folder:
C:\Program Files\Microsoft SQL Server Parallel Data Warehouse\100\Hadoop\conf

Copy and paste the account name and the key into the core-site.xml file and restart the APS Region via the APS configuration utility (located in C:\Program Files\Microsoft SQL Server Parallel Data Warehouse\100\dwconfig.exe)

Last step is to Configure DNS forwarding on the DNS servers of both the APS Active Directory Nodes. That’s all!
Uploading data to Windows Azure Blob Storage
APS Polybase supports various external file formats like Delimited Text, Optimized Row Columnar (ORC) and Record Columnar File (RcFile) each with its specific compression and approach ranging from Hive Serializer and Deserializers (SerDe) to the Snappy Codec to GZIP. To put them to the test we will use an APS with a relative low upload link of 2 MByte/sec to Azure. Another good reason to put the compression algorithms to the test!
Defining a Baseline
As a baseline we will upload 10 million rows from an APS table into Azure via an ‘Create Table As Select’ (CETAS) command. As part of the CETAS command you have to specify the external data source where to store/pull the data from, the file format and compression type to use:
Setup external Data Source:
To list all already defined Data sources on the APS run: SELECT * FROM sys.external_file_formats
To Create a new External Data Source to connect to your Azure storage account, you have to specify the ‘LOCATION’ part properly: the first part is the container name and the second the storage account name. The syntax will look something similar to:
CREATE EXTERNAL DATA SOURCE APS_WASB1
WITH (
      TYPE = HADOOP,
      LOCATION = 'wasbs://Henks_Container@henks_storage_account.blob.core.windows.net/'
     );
Setup a File format
To list all already defined File Formats on the APS run : SELECT * from sys.external_data_sources
To create a new external File Format to support TextDelimited:
 CREATE EXTERNAL FILE FORMAT TextDelimited
WITH (
      FORMAT_TYPE = DELIMITEDTEXT
     )
And now we are good to go to run a CETAS Baseline test
---------------------------------------------------------------
-- TEST 1: BASELINE:
-- Exporting 10 Million rows to Windows Azure blob Storage
---------------------------------------------------------------

CREATE EXTERNAL TABLE [Azure_10Million_Row_Baseline]
WITH
    (
      LOCATION='/LineItem10Mill_Base',
      DATA_SOURCE = APS_WASB1,
      FILE_FORMAT = TextDelimited,
      REJECT_TYPE = VALUE,
      REJECT_VALUE = 10
    )
 AS SELECT * FROM [10Million_CCI_REPL]
Via the APS Admin console we monitor the progression and note the Query ID (QID60313220):
It took 11 minutes and 39 seconds to upload the 10 million rows to Azure.
With as result a regular table that we can query as any other SQL database table but with the data stored in Azure!

Microsoft Azure –Block- Blob Storage
To monitor the Azure side there is a great utility on CodePlex called Azure Storage Explorer. To set it up you will need your Azure Storage account name and -key once more.
If you take a close look at the filename that got created you will notice that the filename actually contains the APS QueryID number as part of the file naming convention as well as the date_time stamp. This makes it very easy to trace where the data originated from!
Our CETAS baseline export of 10 million rows resulted in a file of 1.75GB in size (== effective 2 MByte/sec upload):

Adding compression to CETAS
As part of the ‘Create External Table AS Select’ you can specify a compression method so the data will be compressed before it’s uploaded cross the wire to Azure. APS supports a variety of compression codecs with the various file formats. The Text Delimited file format with either one of the 2 supported compression algorithms (the ‘default codec’ and ‘Gzip codec’) provide both a great improvement high throughput rate and also an okay data compression ratio.
Adding the Data compression method to a Delimited Text file format called ‘TextDelimited_GZIP’:
 CREATE EXTERNAL FILE FORMAT TextDelimited_GZIP
WITH (
    FORMAT_TYPE = DELIMITEDTEXT,
    FORMAT_OPTIONS
    (
      FIELD_TERMINATOR = '\t'
    ),
    DATA_COMPRESSION = 'org.apache.hadoop.io.compress.GzipCodec'
)
To start a CETAS with the GZIP compression method, just include this new file format in the statement:
-----------------------------------------------------
-- Test 2: GZIP text delimited
-----------------------------------------------------

CREATE EXTERNAL TABLE [Azure_10Mill_TextDelimited_GZIP]
WITH
    (
      LOCATION='/LineItem10Mill_TextDelimited_GZIP',
      DATA_SOURCE = APS_WASB1,
      FILE_FORMAT = TextDelimited_GZIP,
      REJECT_TYPE = VALUE,
      REJECT_VALUE = 10
    )
 AS SELECT * FROM [10Million_CCI_REPL]
When we look via the APS Admin console at the MPP query plan generated for the CETAS command something special shows: as very last step of the data export statistics are being created; APS Polybase adds statistical information to exported data to make smarter decisions once we start querying the data!

The filename of the data uploaded into Azure reflects the GZIP format; the file extension ‘.gz’ is added automatically. It took only 2minutes and 48 seconds to upload the same 10 million rows; that means 4.1 times faster upload! Also the file size decreased from 1.35 GByte (officially) to only 414.5 MBytes. With the GZIP method we achieved an 3.4x reduction in size!

APS automatically adds Parallelism to CETAS
When you export data from an APS distributed table where data is striped across multiple servers and tables the CETAS command will automatically start for every table distribution an upload into a separate file: In the example below an 8 node APS with 64 distributions will create 64 Gzipped data files in parallel, each containing a fraction of the dataset:

If you would like to export all data from an distributed table into a single file instead, just specify as part of your CETAS command a SELECT TOP (..) *; the TOP () will serialize the upload request. (Under the hood the Data Movement Service (DMS) from the APS Control Node will take over control and upload the data into a single file in the blob container).
SSDT
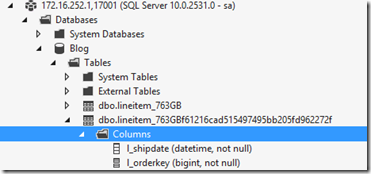
The data we just uploaded can be queried as any other regular SQL table; to view all the External Tables available in a database just expand the ‘Tables’ folder in SSDT and view the names of all External Tables. Use a table naming convention to easily identify where the external data resides since you will query these external tables transparently as any other table. Data stored in Windows Azure Blob Storage and/or Hadoop can be joined and queried like if the data would have reside within the database. Polybase provides a virtual data layer.

For each of the 3 supported external file formats and the various data compression methods I recorded the time it took to upload the 10 million rows during at least 2 test runs. The best upload time and file size is recorded in the table below:

Wrap-up
The APS Polybase feature is a very powerful option that enables access to data stored outside of the SQL database; it enables you to query, import and export data stored in external Hadoop data sources by using standard SQL statements. It allows you to refer to data that resides in either a distributed Hadoop file system or in the cloud via Microsoft Azure Blob Storage (WASB) as a virtual data layer.
To increase data transport throughput rates Polybase supports various data compression methods to reduce the time needed to upload data by a factor 4! Also the storage capacity needed reduces significant. Also parallelism is created automatically where possible to maximize the data throughput!


