Introduction to SQL Server 2012 Parallel Data Warehouse

Surprisingly how we over the years have accepted that we need to invest a lot of time and energy to move data from ‘A’ to ‘B’  and to maintain a well performing data warehouse platform where your reports & queries respond within a reasonable amount of time (and I’m not referring to just SQL Server :-) )  But ‘Good’ isn’t good enough anymore; by entering the world of Big Data and the Internet Of Things your users expect sub-second ‘search engine alike’ response times from their in-company data platform too, even if new data hasn’t been crawled before or when data has to be read from an Hadoop cluster…

Luckily we can shift gears easily and move from a reactive- into a predictive mode;  SQL Server 2012 Parallel Data Warehouse (aka PDW) is just that; the next generation data platform that performs at top speed from day one with many of the tuning optimizations as described on my blog already build in. With PDW in place you can focus on other things than Query performance tuning or waiting for data loads and exports to complete ! 

The secret sauce

The beauty of PDW is the simplicity of the scalability concept: just add more SQL Server Compute nodes and benefit from the seamless scale out engine: under the hood the PDW engine ‘stripes’  the data across many so called ‘data distributions’  (== 8 separate tables per compute node) a concept that makes it easy to keep up with your data growth needs and performance needs. 

Also, SQL Server 2012 PDW already offers the new native updateable clustered columnstore Index (CCI) storage format. I’ve been working with the CCI for over 8 months now and I must say; it works like a charm! High data selectivity and significant higher data compression ratios for faster highly Parallelized query response timings. (Expect runtimes of just minutes instead of hours, or seconds instead of minutes) The new CCI algorithms allow you to search through data faster; whether is doesn’t matter if the data already resides In-Memory or not.
Your business analysts and end users will generate more extensive results faster.

Schematic overview of the SQL PDW parallel scalability concept; simply add more Compute nodes to increase the data load and query speed + overall storage capacity.

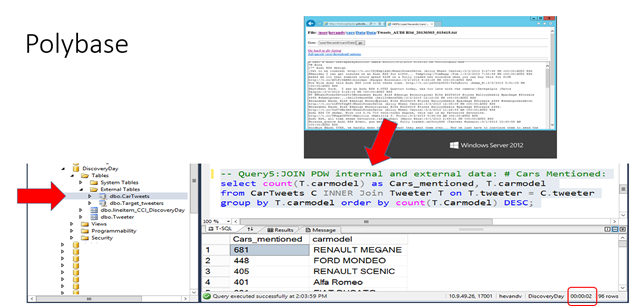
Polybase for high-speed parallel Hadoop access

For many customers Hadoop is still just a topic on the ‘todo’ list but in case you want to get started you don’t have to be afraid of creating another data island in the lake; PDW  has build in support for either writing data out or querying data stored on an Hadoop filesystem via Polybase. Polybase is fast via direct parallel HDFS access to the data nodes. From within your SQL PDW databases simply use the ‘Create External table’  command and you can both either store- or query data to /from hadoop!

Below an example of querying an hadoop cluster folder that contains many separate files with Twitter feeds; access the twitter data with a regular query without even bothering where the data comes from and receive answers within sub-seconds, as if it was stored within PDW locally !

Query Twitter Data log files stored on hadoop from within SQL Server PDW. 

More info on PDW Benefits (Must Reads!)

If you want to read more on SQL Server PDW, please check out :  upgradetopdw.com

The PDW landing pages is simple to remember :  www.microsoft.com/PDW

Or… download the whitepaper in Word format that I helped writing to explain PDW and the benefits that my customers value most when they start using SQL Server 2012 PDW,  Enjoy !

download.microsoft.com/SQL Server 2012 Parallel Data Warehouse – A Breakthrough Platform

GD Star Rating
loading...
GD Star Rating
loading...

SQL under the hood (Part 2): Estimate the SQL Disk IO Workload based on the Virtual File Stats DMV.

Do you know how much data is being written and read on a daily basis by your SQL Server databases? SQL Server keeps track of these stats for you already; you just have to retrieve and interpret them correctly so you can turn this data into valuable information.

A couple of years ago I was looking for a way to quickly quantify the overall SQL workload of a server that I never had seen before and noticed the beauty of the sys.dm_io_virtual_file_stats DMV. This DMV returns the I/O statistics for each SQL database; for both the data- and the log files collected since an SQL Server instance has been started. You can take a rough ‘guestimate’  about how much data physically is being touched and processed by you disk subsystem if you divide these numbers by the uptime of the SQL instance and turn them into a metric you prefer;  bytes per second or Gigabytes processed per day.

The VFS Query

Every step in the query below is documented and self-explanatory; it just queries sys.databases to figure out when the SQL instance started, the sys.dm_io_virtual_file_stats DMV.

--------------------------------------------------------------------------------------------
--  Script to snapshot the SQL SMP Virtual Filestats  and calculate and average per day 
--  based on the SQL instance uptime (calc. in seconds)
--  V1.1 by Henk van der Valk    Script provided 'as-is'
--------------------------------------------------------------------------------------------
USE master
go

SET NOCOUNT ON
DECLARE @crDate DateTime; 
DECLARE @hours DECIMAL(18,3), @Days int;
DECLARE @FinalHours int, @FinalMinutes int, @FinalSeconds int, @total_seconds  int;


-- Determine uptime by checking Tempdb creation datetime:
SELECT top 1 @crdate=create_date FROM sys.databases WHERE NAME='tempdb'
SELECT @hours = DATEDIFF(ss,@crDate,GETDATE())/CAST(60 AS Decimal)/CAST(60 AS Decimal);
PRINT 'SQL Server instance '+ @@SERVERNAME + '\' + @@SERVICENAME + ' is Up since: ' + CAST (@crdate as varchar)  ;

-- From hours to days:
SELECT @Days = @hours/CAST(24 AS Decimal);

-- Determine the remaining part of the hours: 
SELECT @FinalHours = @hours - (@Days*CAST(24 AS Decimal))

-- Remaining minutes: 
SELECT @FinalMinutes = (@hours - (@Days*CAST(24 AS Decimal)) - @FinalHours ) * 60;

-- Remaining seconds: 
SELECT @FinalSeconds = (((@hours - (@Days*CAST(24 AS Decimal)) - @FinalHours ) * 60) - @Finalminutes) * 60;

PRINT 'Or: '+ CAST(@Days as varchar) + ' Days, ' + CAST(@FinalHours as varchar) + ' Hours,'
+ CAST(@FinalMinutes as varchar) + ' Minutes and ' +  CAST(@FinalSeconds as varchar) + ' Seconds.'

SELECT  @total_seconds = (CAST(@Days AS decimal(12,2))*24*3600 + CAST(@Finalhours AS decimal(12,2))*3600 + CAST(@Finalminutes AS decimal(12,2))*60 )
+ CAST(@Finalseconds AS decimal(12,2))
PRINT 'Total uptime in seconds: '+ CONVERT(VARCHAR(20) ,@total_seconds )

SELECT @@SERVERNAME as Hostname, @@SERVICENAME as Instancename, @crdate AS SQL_Start_Date_Time ,  @total_seconds as TotalSeconds_Up

SELECT  DB_NAME(database_id) AS [Database Name] ,
        file_id ,
        io_stall_read_ms ,
        num_of_reads ,
            (num_of_bytes_read / 1024 / 1024 /1024) as GB_Read_Total,
            num_of_bytes_read / @total_seconds * 3600 * 24 /1024/1024/1024  as AVG_GB_read_per_day_ESTIMATE,
        CAST(io_stall_read_ms / ( 1.0 + num_of_reads ) AS NUMERIC(10, 1))
            AS [avg_read_stall_ms] ,
        io_stall_write_ms ,
        num_of_writes ,
            num_of_bytes_written / 1024 / 1024/1024 as GB_Written_Total,
            num_of_bytes_written /@total_seconds * 3600 * 24 /1024/1024/1024  as AVG_GB_Written_per_day_ESTIMATE,
        CAST(io_stall_write_ms / ( 1.0 + num_of_writes ) AS NUMERIC(10, 1))
            AS [avg_write_stall_ms] ,
        io_stall_read_ms + io_stall_write_ms AS [IO_Stalls] ,
        num_of_reads + num_of_writes AS [Total_IO] ,
        CAST(( io_stall_read_ms + io_stall_write_ms ) / ( 1.0 + num_of_reads
                                                          + num_of_writes)
           AS NUMERIC(10,1)) AS [AVG_IO_stall_ms]
FROM    sys.dm_io_virtual_file_stats(NULL, NULL)
--ORDER BY avg_io_stall_ms DESC ;
order by GB_read_total DESC


Sample VFS Query output

The output example below shows the regular VFS output with some additional columns to quantify the workload; for each database file it shows the Gigabytes_Read_Total since start, the Average_Gigabytes_Read_per_Day, assuming a 24×7 operation, the average_read_stall_milliseconds that users have waited for reads issued on a file, and similar columns for the write stats. 

Don’t be surprised when the tempdb traffic is by far the largest Disk IO consumer or when an unbalance between database files and stall timings show.  This could be a good place to start monitoring the effective IO response timings of the LUNS you have available and if they cope well or that you are suffering from some hotspots.

Estimate the GBytes processed by SQL Server


Wrap up

The information provided by the sys.dm_io_virtual_file_stats DMV will help you to quantify the daily Disk IO workload of your SQL Servers. When you store the results, over time, it will also show you if the overall usage of your SQL environment increases.

I’ve seen VFS stats of production databases who are reading on average 6-19 Terabyte/day. When you update more than 1 TB+/day on your main production databases, please shoot me a mail ; your workload very likely qualifies for SQL Server Parallel Data Warehouse!

GD Star Rating
loading...
GD Star Rating
loading...
Better Tag Cloud